


U.S. Treasury Bond Yields, Where to From Here?
Interest-Rates / US Bonds Aug 17, 2009 - 11:38 AM GMTBy: Mike_Shedlock

 Last week's treasury rally was the biggest in eight months notes Bloomberg in Treasuries Rise Amid Flat Consumer Prices, Declining Confidence.
"Ten-year notes headed for their biggest weekly gain in almost eight months after the Reuters/University of Michigan preliminary index of consumer sentiment decreased to 63.2, below the 69 median forecast of economists surveyed by Bloomberg News. Compared with a year earlier, consumer prices dropped by the most since 1950."
Once again, the dip in consumer confidence was "unexpected". Economists simply have not grasped changes in social mood. Others have.
Prices and Social Mood
Last Friday Professor Depew talked about prices and social mood in an excellent rendition of "Five Things" . In case you missed it, please consider Five Things: Do We Need Debt to Recover?
My post, Misguided Worries About Inflation touched on similar themes.
With stores such as Walmart (WMT), Safeway (SWY), Nordstrom (JWN), Abercrombie & Fitch (ANF) and American Eagle Outfitters (AEO) lowering prices in the face of declining consumer confidence about jobs, and with the reflation trade in the indicies as noted by the S&P 500 rally (SPY) starting to falter, one might expect treasuries to rally.
$TNX - 10 Year Treasury Daily Chart
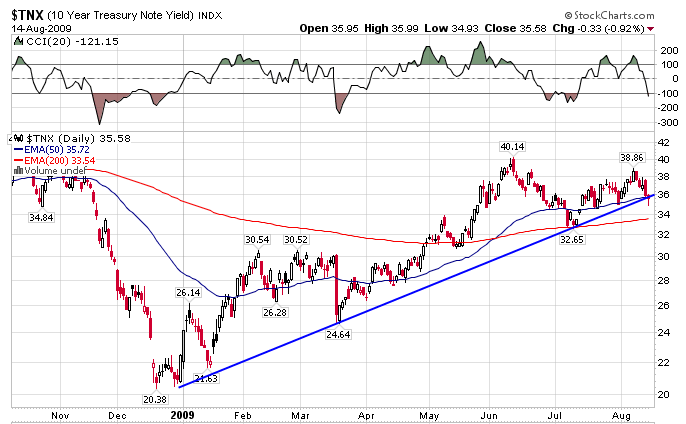
The daily chart shows the uptrend line in yields from the December 2008 low has been breached. One should not treat these breaks as "bibles" because at this point, the break can be a meaningless blip. However, this break is an early warning signal to treasury bears.
The weekly chart is more interesting.
$TNX - 10 Year Treasury Weekly Chart
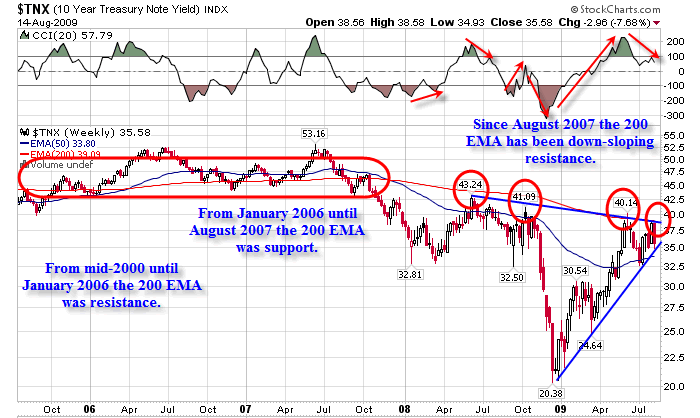
The weekly chart is much more interesting. From 2000 until mid-2007 ten year treasury yields meandered along a very flat "calm before the storm" 200 EMA (Exponential Moving Average). In late 2007 there was a significant trendline break and yields plunged to all-time record lows across the entire treasury curve.
Now after an extremely sharp rally in yields, treasuries are bumping up against a down-sloping 200 EMA . The question at hand is "Will resistance hold?"
I like the odds here. The CCI Commodity Channel Index, a momentum indicator, is showing negative divergences that would favor lower yields. And fundamentally the reflation trade (a massive bet on risk) seems way overdone. Treasury yields and the S&P 500 (SPY) have been negatively correlated for a while. It pays to look at these inter-market relationships lest one get carried away with the sentiment such as "To the moon Alice, To the moon".
Ways To Play
No, Alice, treasury yields likely aren't going to the moon, at least not anytime soon.
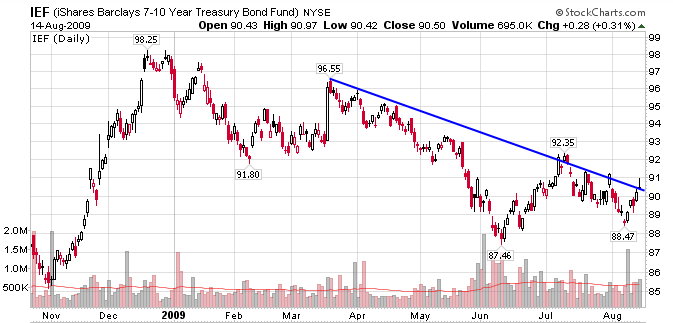
If you like long-dated treasuries the easiest ways to play are TLT and IEF, treasury ETFs.
IEF - Barclays 7-10 Year Treasury Bond Fund
TLT - Barclays 20+ Year Treasury Bond Fund
Of the two, the charts show that TLT is the more aggressive of the two ETFs. The price range on TLT from the recent top was $120.56 - $87.28 while the range for IEF was $98.25 - $87.46.
One can blend the two to achieve a risk profile in the middle.
Rent, Don't Buy and Hold
I frequently hear the complaint "who wants to hold treasuries for 30 years?" Well, certainly not me. Indeed, one needs to be cognizant that the bottom in treasury yields may be in and that the 30 year bull market in treasuries may be over. However, there are ample opportunities for swing trades in either direction, and this is an opportunity that may last much longer and go much further than treasury bears think given the misguided worries about inflation.
Please note: The ideas presented above constitute my thinking at the current time. However, that thinking can change at any time, without warning, and without notice. Neither this, nor any of my posts constitutes a recommendation.
By Mike "Mish" Shedlock
http://globaleconomicanalysis.blogspot.com
Click Here To Scroll Thru My Recent Post List
Mike Shedlock / Mish is a registered investment advisor representative for SitkaPacific Capital Management . Sitka Pacific is an asset management firm whose goal is strong performance and low volatility, regardless of market direction.
Visit Sitka Pacific's Account Management Page to learn more about wealth management and capital preservation strategies of Sitka Pacific.
I do weekly podcasts every Thursday on HoweStreet and a brief 7 minute segment on Saturday on CKNW AM 980 in Vancouver.
When not writing about stocks or the economy I spends a great deal of time on photography and in the garden. I have over 80 magazine and book cover credits. Some of my Wisconsin and gardening images can be seen at MichaelShedlock.com .
© 2009 Mike Shedlock, All Rights Reserved
© 2005-2022 http://www.MarketOracle.co.uk - The Market Oracle is a FREE Daily Financial Markets Analysis & Forecasting online publication.