


Gold Continues Towards the Mouth of a Megaphone Pattern
Commodities / Gold & Silver 2009 Aug 30, 2009 - 01:26 PM GMTBy: Merv_Burak

 Gold price continues to move towards the mouth of a megaphone pattern. The longer it stays within the megaphone the weaker a break-out may be. Let’s hear it for a break-out NOW, and on the up side.
GOLD - LINES ON A CHART
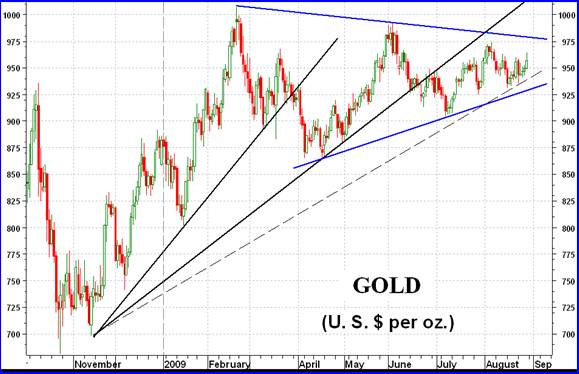
Technicians live for charts. They like to draw all sorts of lines on them, some are even useful. Here I have drawn two sets of lines indicating two different patterns. Each pattern has its own meaning and both may or may not be telling us the same story.
The first set of lines are the blue lines which make up that megaphone pattern I have been mentioning over the past few weeks. The price of gold has been trapped inside this pattern for about half a year. When will it break out is anyone’s guess. It could just as easily slowly meander to the apex of the megaphone and just continue leisurely on its lateral way. Some call this pattern a symmetrical triangle (megaphone sounds more sophisticated). The question becomes, “which way next?” Well, most books on technical analysis suggest that a symmetrical triangle is a “continuation” pattern with the trend continuing in the direction that it was in on entry into the pattern. This would be the up side. In my view a 6 month triangle after only a 3 month up trend just doesn’t sound right, but who knows, maybe it will continue upwards. I look at this as a megaphone, the break-out direction is unknown but once broken out the new trend should continue for some time. The larger the megaphone the longer the new trend. The only proviso to this suggestion is that the break-out must come around the two thirds way towards the apex. We are there and starting to get further towards the apex. As we get closer to the megaphone apex the new trend becomes weaker and weaker.
The other set of lines are my FAN PRINCIPLE lines. Here we see what I call a BEARISH DECELLERATION FAN. Bearish because the FAN break-out would be to the down side for the FAN to be valid. Deceleration suggests that with each fan the present up trend is getting weaker and weaker. With this FAN pattern the breaking of the first FAN trend line is not important. The breaking of the second FAN trend line suggests a trend reversal while the breaking of the third FAN trend line is a confirmation of the reversal of trend. The location of the third FAN trend line is still not confirmed but the dash line suggests the most likely location of that trend line.
So, what we have here are two techniques, one suggests a bull market continuation and the other suggests a bear market reversal. Flip a coin and take your chances.
LONG TERM
Let’s get back to the real world and see what the indicators are telling us. First, the long term P&F chart has still not had enough action to change its bullish trend. If memory serves me correctly I have an initial projection based upon the most recent upside break, to the $1050 level. That would be just about its previous high point reached in early 2008.
The price of gold remains above its positive sloping long term moving average line and the momentum indicator remains in its positive zone. Although positive the long term momentum has been showing weakness in the price movement for some time now. It made its peak during the price rise in mid 2006 and ever since each successive price peak has been performed with a continuing weaker momentum. Although the latest price rise has taken us to almost the previous peaks the momentum has barely improved versus its previous moves. I guess one can say that there has not been much enthusiasm behind the recent bullish price moves. On the other hand, although the daily volume action remains low the cumulative effect as shown in the volume indicator is something else. The volume indicator is another story. It has been showing cumulative strength recently. It has moved into new recovery highs although it is still a little way from all time highs. Unlike the momentum indicator, the volume indicator is suggesting underlying speculative continued interest in gold. We keep getting positive and negative indicators. Which, oh which ones to believe.
Rightly or wrongly I fall back on my proprietary technique of combining the various indicators to come up with a rating for the market at this time. This tells me the long term rating is still BULLISH.
INTERMEDIATE TERM
After flirting with the intermediate term moving average line earlier in the week the price of gold finally shot up and closed the week above the line. The moving average slope has followed the price by turning very slightly upwards. Except for a few days in July the momentum indicator has remained in the positive zone for over 4 months and is once more above its positive sloping trigger line. As for the volume indicator, it continues to move higher above its positive trigger line. Everything points to the intermediate term rating as remaining BULLISH.
SHORT TERM
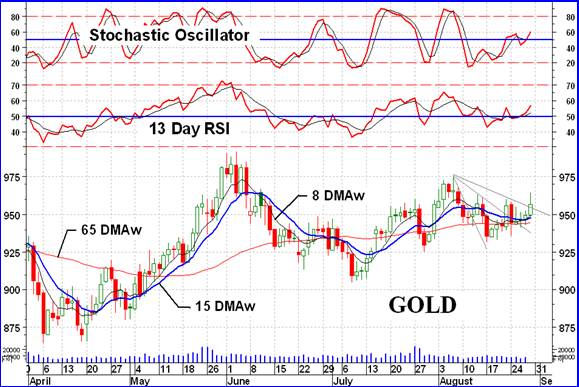
From a short term perspective everything seems to be turning for the better. Gold has once more moved above its moving average line and the line slope has turned upward. The very short term moving average line has once more crossed above the short term line to confirm a short term positive trend. Friday’s price action looks good although I would have preferred to see the closing price closer to the daily high than near the middle of the daily trading range. The short term momentum indicator is back in its positive zone, heading higher above its positive trigger line. The daily volume action is still low and could be a lot better. All in all, the short term rating is BULLISH. Note the short term FAN PRINCIPLE trend lines. This is a bullish decelerating fan. We have a confirmation of the bull but it is a short term indicator.
As for the immediate direction of least resistance, that looks now like the up side. All indicators are in positive territory and moving higher, even the aggressive Stochastic Oscillator. It is still nowhere near overbought so there appears to be more upside capability to the move.
SILVER
Once again silver has out performed gold this past week. Silver gained 4.5% in price while gold languished with only a 0.1% gain. We continue to see silver out performing gold BUT silver is working from a far lower base. Gold is not that far from its previous all time high while silver still has a long way to go. While the initial projection for silver is to the $18.50 level, somewhat below its previous $21 high, gold’s initial projection for this move is to the $1050 level, just a shade above its previous high. However, if there is more upside in store for silver then there is more upside for the silver stocks. That may still be the place for precious metal speculation, at this time.
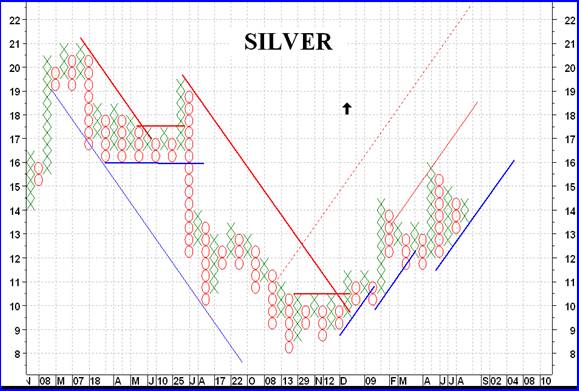
Looking at a candlestick chart of silver with its appropriate indicators I see that silver rating is BULLISH for all three time periods. However, a little more work needs to be done on the up side to give a more comfortable feeling about the up trend.
PRECIOUS METAL STOCKS
It was a reasonable week for precious metal stocks. Almost all the stock Indices in my Table (below) closed on the up side. Only the FTSE Africa Index (with a 0.4% loss) and the Merv’s Penny Arcade (with a 0.1% loss) were not going the right way. Although there were only 8 winners in the Penny Arcade Index (out of 30 component stocks) 6 of these were double digit winners, one gaining a full 50% on the week. However, the rest were losers and their effect overcame these few winners in the final calculation. Unlike the other Indices, this Penny Arcade Index is expected to be revised on a more aggressive schedule. These types of stocks have a habit of coming, doing their thing and then disappearing quite rapidly. It’s that “disappearing quite rapidly” thing that I am trying to avoid in the Index.
Although most of the stock Indices are still below their highs of a few months back there is one Index that has just inched into new recovery highs. The Merv’s Gold and Silver 160 Index has just moved into new recovery high territory. The AVERAGE price of these 160 gold and silver stocks, including the top 100 by market value traded on the North American market, is doing better than the major Indices or the various Merv’s sector Indices. That would suggest that the majority of the bottom 60 stocks are the movers that are lifting this Index higher. The Merv’s Gold & Silver 100 Index is, like the 160 Index, still below its earlier high, leaving only those bottom 60 to lift the universe higher. Markets, especially the aggressive resource markets, do not normally end while the more speculative of their stocks are still doing great. These speculatives normally lead the resource market to the top and over. They do not seem to be there yet.
MERV’S PRECIOUS METALS INDICES TABLE
Well, that’s it for another week.
By Merv Burak, CMT
Hudson Aero/Systems Inc.
Technical Information Group
for Merv's Precious Metals Central
For DAILY Uranium stock commentary and WEEKLY Uranium market update check out my new Technically Uranium with Merv blog at http://techuranium.blogspot.com .
During the day Merv practices his engineering profession as a Consulting Aerospace Engineer. Once the sun goes down and night descends upon the earth Merv dons his other hat as a Chartered Market Technician ( CMT ) and tries to decipher what's going on in the securities markets. As an underground surveyor in the gold mines of Canada 's Northwest Territories in his youth, Merv has a soft spot for the gold industry and has developed several Gold Indices reflecting different aspects of the industry. As a basically lazy individual Merv's driving focus is to KEEP IT SIMPLE .
To find out more about Merv's various Gold Indices and component stocks, please visit http://preciousmetalscentral.com . There you will find samples of the Indices and their component stocks plus other publications of interest to gold investors.
Before you invest, Always check your market timing with a Qualified Professional Market Technician
Merv Burak Archive |
© 2005-2022 http://www.MarketOracle.co.uk - The Market Oracle is a FREE Daily Financial Markets Analysis & Forecasting online publication.