The S&P Stock Market Rally, How Much Higher?
Stock-Markets / Stock Index Trading Sep 18, 2009 - 02:57 AM GMTBy: Seven_Days_Ahead
 The recent rally in the S&P 500 really is looking like the birth of a new bull market. This, after a period during which the market rallied on scattered signs that the recession might be ending, interspersed with corrections lower as other data suggested a false dawn. Now data has begun began to point more firmly towards economic recovery.
The Fed has tried to play down these early signs by talking up the downside risks to the economy that remain. It has also pledged to keep monetary policy at exceptionally low levels for an extended period.
But over recent weeks the housing market has shown clear improvement, indeed the last two New Home sales reports showed a month-on-month increase in excess of 9.0%. Just as the housing market led the US and global economy into recession, traders and economists are have been looking to it to lead the economy back to growth.
But two other key ingredients needed to fall into place before they could be certain:
- The Business inventory cycle has yet to turn, and
- Consumer demand which accounts for over two thirds of GDP needed to turn too.
As regards consumer demand, this week the US retail sales report turned unambiguously bullish. A strong report was anticipated on the back of the US government’s cash for clunkers scheme, but the report exceeded all expectations. The headline report came in at +2.7%, but of greater importance, the Ex-Autos report came in at +1.1%. This signals the consumer is spending money and the economy is not only on the mend, but as Fed Chairman Bernanke said yesterday ”the economy is likely already out of recession”.
This is great news for stocks as corporate profits should begin to strengthen and drive equities higher.
Indeed, if any further evidence was required that the economy is bouncing back, that came last week in the shape of the US trade report: the trade deficit came in much wider than expected driven by a record increase of imports. This shows demand is strengthening and, as the economic activity begins to pick up further, we judge the trade deficit will grow too.
In all the equity markets look an exciting place to be and we think the rally is only at an early stage.
The Technical Trader’s view:
|
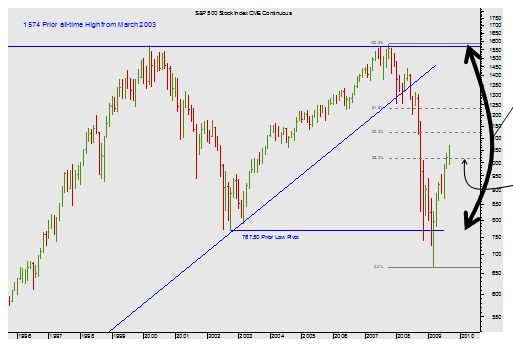
MONTHLY CHART The full majesty of the monthly chart is really to be found in the creation of a massive trading range. Note too, within that range, the power of the rally that drove the market up through the 38.2% Fibonacci resistance at 1012-18. Look closer still.
|
|
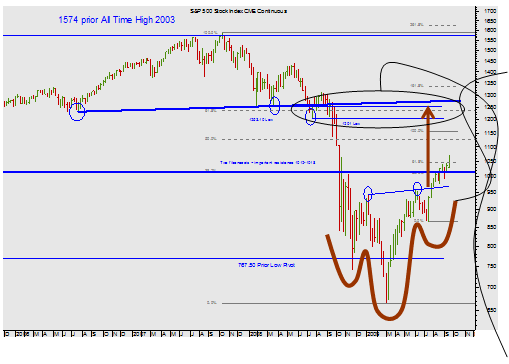
WEEKLY CHART The creation of a Head and Shoulders Reversal at the lower boundary of the trading range is the current driving force behind the current rally. Note well the minimum target of the Head and Shoulders pattern (adjusted for the log scale) – just short of the 1253 low resistance, and close by the Neckline of the H&S pattern that drove the market down in the first place. For choice we feel that the band1201 -1253 would be a good profit-taking area. As this is being written we are currently trading 1063 |
Mark Sturdy
John Lewis
Seven Days Ahead
Be sure to sign up for and receive these articles automatically at Market Updates
Mark Sturdy, John Lewis & Philip Allwright, write exclusively for Seven Days Ahead a regulated financial advisor selling professional-level technical and macro analysis and high-performing trade recommendations with detailed risk control for banks, hedge funds, and expert private investors around the world. Check out our subscriptions.
© 2009 Copyright Seven Days Ahead - All Rights Reserved
Disclaimer: The above is a matter of opinion provided for general information purposes only and is not intended as investment advice. Information and analysis above are derived from sources and utilising methods believed to be reliable, but we cannot accept responsibility for any losses you may incur as a result of this analysis. Individuals should consult with their personal financial advisors.
Seven Days Ahead Archive |
© 2005-2022 http://www.MarketOracle.co.uk - The Market Oracle is a FREE Daily Financial Markets Analysis & Forecasting online publication.


