Precious Metals Silver SLV and Gold GLD ETFs
Commodities / Gold & Silver 2009 Nov 22, 2009 - 11:18 AM GMTBy: Piazzi
 Since the last time I wrote about SLV, silver price has strengthened dramatically and has hit a new high for the year
In that post, I mentioned the overall technical posture of SLV and said
Overall SLV has a positive technical profile, and as long as it maintains its posture, I might be tempted to treat pullbacks as buying opportunities.
At the time, SLV was around 17, and I was contemplating scenarios in case price would overlap what I count as the top of intermediate wave 1 (purple). Those concerns were soon laid to rest as Silver, and SLV, powered on and made new uptrend highs.
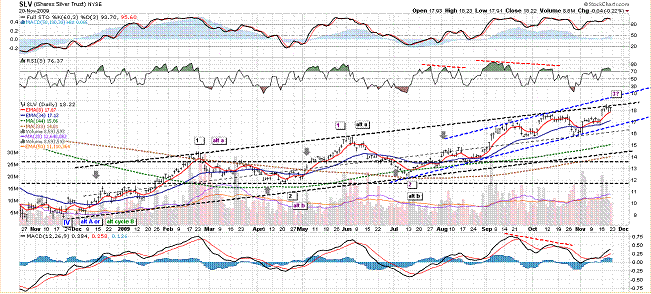
Notice the volume in the beginning of November, and the volume mid-November. There is a lot of force behind the recent movement. The ETF may be in the process of trend acceleration as it has stayed in the upper half of the its price channel from 2008 lows, and has been hitting the top of the channel multiple times during recent months. If so, it has to break above the top channel line, and it needs to ideally get very overbought. After that (if it happens), I would like it to find support for any pullbacks no lower than the 17-18 range.
Failure to get extremely overbought and a drop into the bottom half of the channel may be early signs of price weakness.
In the previous post, I said that I had two targets for SLV, 18.50 and 19.20. The 18.50 area has been achieved. 19.20 is still a target.
I calculate my price points through number of methods, and pick and choose from price sets produced by each method. It can sometimes be a very time consuming exercise. If I wanted to be laid back, I could just use a P&F chart like this
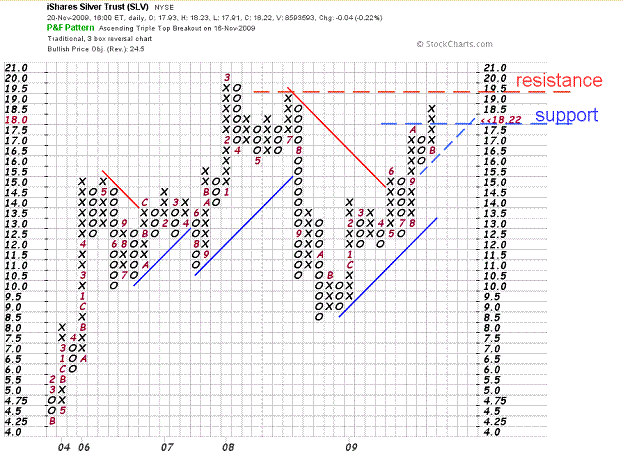
After 19.20, I have 20.30, and 21.30 as targets.
I have support at 17.70, 16.80 and 15.70.
Shorter term, momentum is neutral
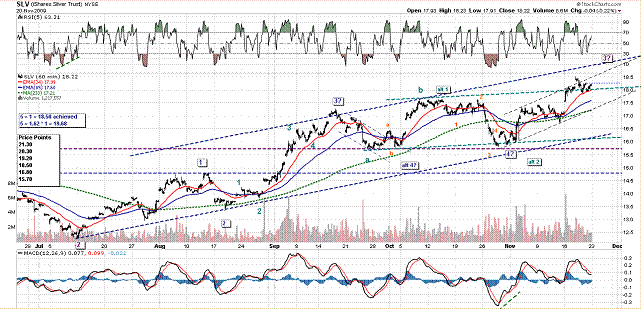
It is possible that the top of Intermediate wave 3 (purple) is in or soon will be. It is also possible that we are witnessing an extended wave in play. I can’t say for sure. It is important not to get caught in the minutiae of every short term wave and instead pay attention to larger waves (trends) and the way price behaves with respect to important price levels and ranges.
Longer term, there is not much complain about, especially for those who are in SLV from lower levels
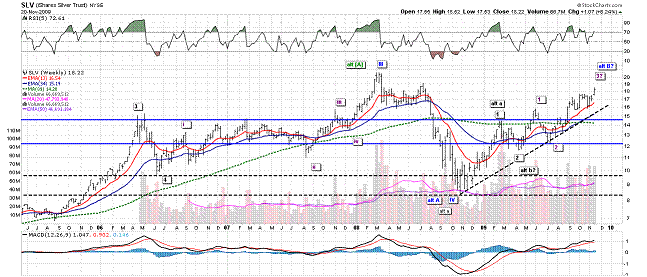
The trend is firmly up at this time, and the ETF has a very positive technical profile. The only negative I can find is that Silver has not made a new all-time high the way Gold has – not yet, anyways.
Speaking of Gold, the Gold ETF, GLD, has been on a tear
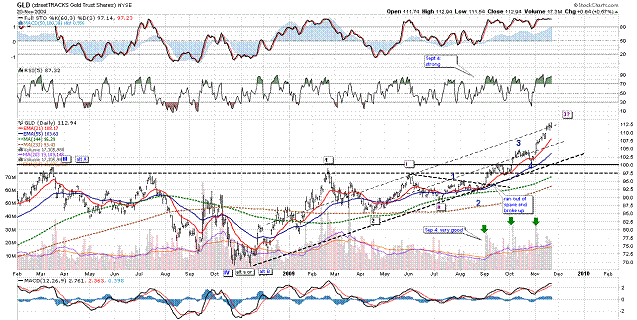
Since catching the breakout in September, GLD has given us no reason to doubt its price performance and objectives. It has gone from strength to strength.
It may be a bit extended for new positions as it is quite a bit of distance from all of its MAs. If the current count is correct, GLD may be near the end of its Intermediate wave 3, or that wave may be extending. Next correction, whenever that may come, may tell us more about what to expect from the ongoing Intermediate 3.
There is support around 105 and around 100. That is quite a few percentage points from the current price of 113. So, I would be hesitant to start a new position, and I might look into ways of trimming/insuring/hedging existing positions.
I had a 110 target that has been achieved. Next, I have 113.50 and 116.50.
Shorter term, we can clearly see the accelerating nature of the price action
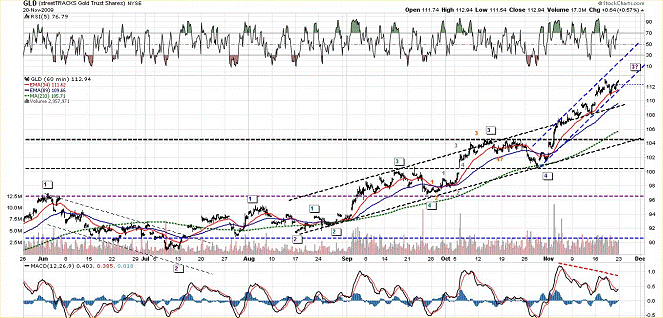
There is no way to say when the rush gets exhausted. I just don’t see any reason to commit more capital at this point.
Stepping back into a larger frame
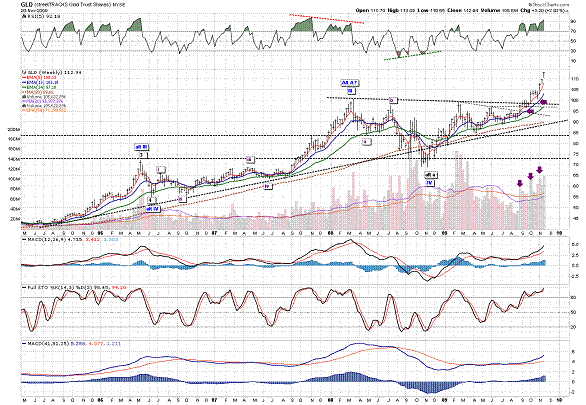
Weekly price has started a vertical ascent, which is supportive of the bullish count and the notion of an intermediate degree 3rd wave. But the vertical nature of the past few weeks, and the high volume bars, make me a bit nervous that we may have a buyer exhaustion setting in soon.
So, once again, I’d rather be cautious and try to protect what I might have built in for now.
Have a Nice Weekend!
By Piazzi
http://markettime.blogspot.com/
I am a self taught market participant with more than 12 years of managing my own money. My main approach is to study macro level conditions affecting the markets, and then use technical analysis to either find opportunities or stay out of trouble. Staying out of trouble (a.k.a Loss) is more important to me than making profits. In addition to my self studies of the markets, I have studied Objective Elliott Wave (OEW) under tutorship of Tony Caldaro.
© 2009 Copyright Piazzi - All Rights Reserved Disclaimer: The above is a matter of opinion provided for general information purposes only and is not intended as investment advice. Information and analysis above are derived from sources and utilising methods believed to be reliable, but we cannot accept responsibility for any losses you may incur as a result of this analysis. Individuals should consult with their personal financial advisors.
© 2005-2022 http://www.MarketOracle.co.uk - The Market Oracle is a FREE Daily Financial Markets Analysis & Forecasting online publication.


