


Are Stock Market Sentiment Indicators Useless?
Stock-Markets / Stock Market Sentiment Dec 30, 2009 - 02:35 AM GMTBy: Guy_Lerner

 As we have chronicled, investor sentiment has not been a very useful tool for timing the market the past 6 months. The "Dumb Money" indicator has been extremely bullish since the end of July, yet the S&P500 has tacked on - albeit begrudgingly - about 14% since that time. Looking at the sentiment picture from the perspective of company insiders, insider selling has exceeded insider buying by historic amounts since May, and company insiders continue to sell significantly despite the strong gains.
So what does it all mean? Are the sentiment indicators useless?
I would still contend that the sentiment indicators are valid tools for timing the market, and that the past year represented one of those rare times (i.e., less than 10% of the time) where it takes "bulls to make a bull market". We saw similar periods in 1995 and in 2003. The "Dumb Money" indicator was bearish in March (i.e., bull signal), and the gains from the lows at S&P500 666 to the first extreme in the "Dumb Money" indicator on May 8, 2009 were almost 40%. That is a 40% gain over 9 weeks!!!! In the last 5 months -with the bulls all lathered up - we have had a 14% gain in 20 weeks. This is nothing to sneeze at mind you, but it pales in comparison to the gains achieved earlier in the rally.
So from this perspective, this is how prices should behave. The greatest, most accelerated gains should occur as the "Dumb Money" indicator travels from extremely bearish (i.e. bull signal) to extremely bullish. A 40% move in 9 weeks sounds like accelerated gains to me. Thereafter, with investor sentiment so bullish, prices should have an upward bias, and this is exactly what has transpired.
There is no doubt this has been an unprecedented move that was not predictable back in March, 2009. The pull backs have been short in both depth and duration, and reflecting this fact, the "Dumb Money" and "Smart Money" indicators, which are more intermediate term in nature, have barely budged for the duration of this rally. But the Rydex indicators have proved to be particularly useful. I have often cited the Rydex leveraged assets at key short term tops, but let's not forget that during that run from S&P500 880 to S&P500 980 we saw the Rydex market timers betting against the S&P500 to an extreme degree for 7 out of those 9 trading days while the market levitated.
Now all of this is with the clarity of hindsight, and the only reason to present this information is to suggest that: 1) sentiment has worked as expected; 2) fear and greed still rule the markets.
So going forward, gauging investor sentiment will continue to have a role in my analysis, and looking outward, I have to wonder why company insiders continue to sell to such an extreme degree or have demonstrated so little buying interest. I don't think they are wrong or have other motives. Eventually, prices will catch up with the fundamentals or vice versa, and the insiders will figure that out. There is no reason to believe that this data set is useless as a market timing tool, and in fact, the further this divergence continues, the greater the likely correction will be.
Predicting when the market will turn lower has become an increasingly a dicey proposition, but I don't think we need to predict the market to function safely in this environment anyway. The high odds play has been to remain patient and buy at the lows of the trading range and sell at the highs. Granted that trading range has become compressed over the past month, and this makes it tough to "jump in" as I believe this willingness or urgency amongst buyers is another sign of a market top. Nonetheless, I stand by the old adage that "the trend is your friend until it ends". But let's be clear that the trend is closer to its end then the beginning.
Lastly, an acceleration of higher prices leading to a "blow off" market top cannot be ruled out. This observation is based upon a weekly close over multiple negative divergence bars and was discussed in "Have You Sold Anything Yet?".
Now Sunday's sentiment charts for your viewing pleasure.
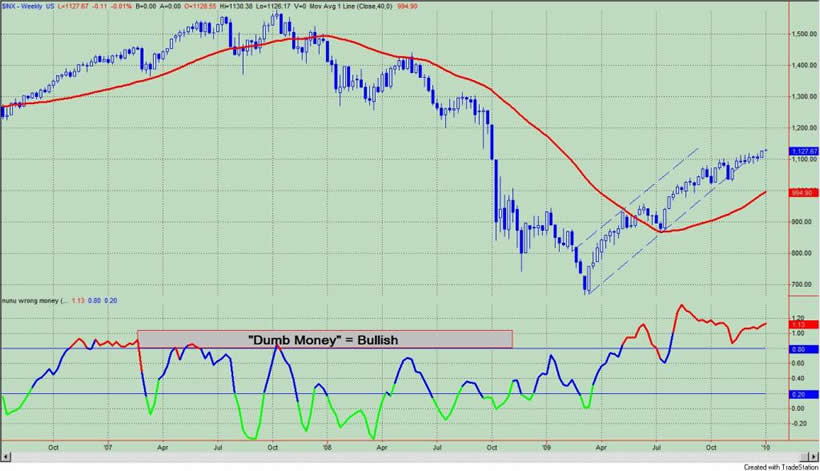
The "Dumb Money" indicator, which is shown in figure 1, looks for extremes in the data from 4 different groups of investors who historically have been wrong on the market: 1) Investor Intelligence; 2) Market Vane; 3) American Association of Individual Investors; and 4) the put call ratio. The "Dumb Money" indicator shows that investors are extremely bullish.
Figure 1. "Dumb Money" Indicator/ weekly
The "Smart Money" indicator is shown in figure 2. The "Smart Money" indicator is a composite of the following data: 1) public to specialist short ratio; 2) specialist short to total short ratio; 3) SP100 option traders. The "Smart Money" indicator is neutral.
Figure 2. "Smart Money" Indicator/ weekly
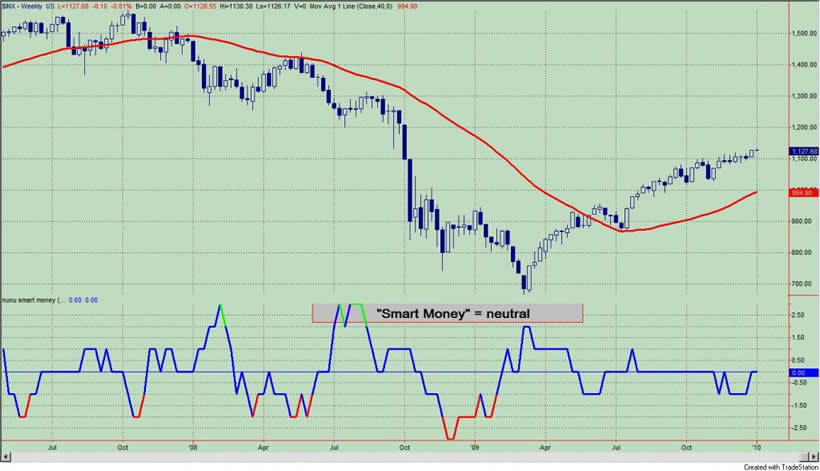
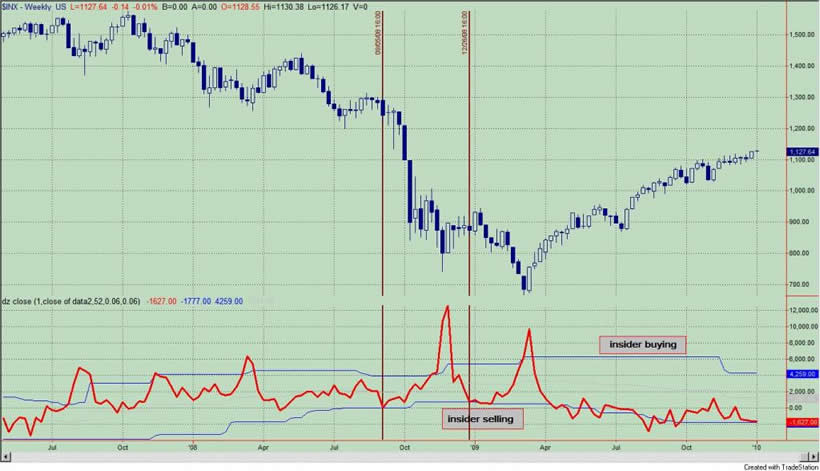
Figure 3 is a weekly chart of the S&P500 with the InsiderScore "entire market" value in the lower panel. From the InsiderScore weekly report we get the insight: 1) "the Weekly Score for the Entire Market fell to its worst level of Q4 2009 and its fifth-worst level of the year."
Figure 3. InsiderScore Entire Market/ weekly
By Guy Lerner
http://thetechnicaltakedotcom.blogspot.com/
Guy M. Lerner, MD is the founder of ARL Advisers, LLC and managing partner of ARL Investment Partners, L.P. Dr. Lerner utilizes a research driven approach to determine those factors which lead to sustainable moves in the markets. He has developed many proprietary tools and trading models in his quest to outperform. Over the past four years, Lerner has shared his innovative approach with the readers of RealMoney.com and TheStreet.com as a featured columnist. He has been a regular guest on the Money Man Radio Show, DEX-TV, routinely published in the some of the most widely-read financial publications and has been a marquee speaker at financial seminars around the world.
© 2009 Copyright Guy Lerner - All Rights Reserved
Disclaimer: The above is a matter of opinion provided for general information purposes only and is not intended as investment advice. Information and analysis above are derived from sources and utilising methods believed to be reliable, but we cannot accept responsibility for any losses you may incur as a result of this analysis. Individuals should consult with their personal financial advisors.
Guy Lerner Archive |
© 2005-2022 http://www.MarketOracle.co.uk - The Market Oracle is a FREE Daily Financial Markets Analysis & Forecasting online publication.