


Which Financial Stocks ETF Is Best For You?
Companies / Investing 2010 Jan 08, 2010 - 02:48 AM GMTBy: Richard_Shaw

 If you chose to supplement your sector-diversified core US equities stock holdings with a diversified financial stocks ETF, which one is best for you?
There are eight possibilities, four of which work for many investors, but only 2 (maybe 3) or 1 (maybe 2) of which work for large accounts. The fund that works for just about any account under $250 million is XLF. The other three funds are VFH, IYG and maybe IXG for some account. The four funds have more favorable profiles considering these three attributes in combination:
1. Trading liquidity
2. Expense ratio
3. Yield
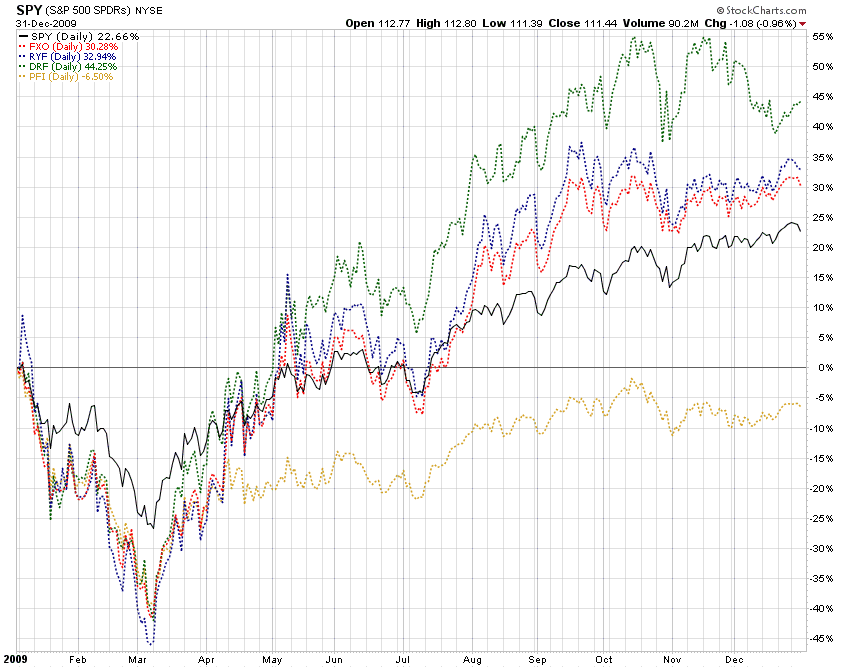
Based on those three attributes, the other financial ETFs do not seem to be great choices at this time. Those less desirable exchange-traded funds are FXO, RYF, DRF, and PFI.
Financial funds, or funds within any other category, are likely to exhibit high correlation of returns. That is particularly so for index or index-like funds, but often for active and passive funds alike. Correlation is not going to help too much in fund selection within a closely related group.
Comparison of historical returns, fundamental valuation and underlying portfolio composition is clearly important too, but to initially separate the wheat from the chaff, a good place to start is with liquidity, expenses and yield.
Correlation:
Let’s dispose of the correlation question up front. Here are 5-year, 3-year and 1-year correlation tables for the four potential best choice funds versus SPY (proxy for the S&P 500 index).
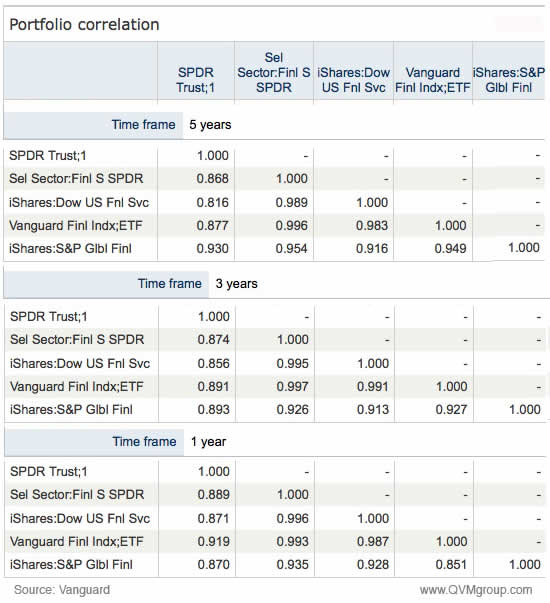
First notice the very high correlation with the S&P 500 — potentially raising questions about the value of separate investment in financials altogether. However, if recovery potential or future yield potential or some other your reason is your motivation, if you chose to supplement your US core equities with financial stocks, we think you should be aware of and invest with liquidity.
Trading Liquidity:
Trading liquidity is about volume, and is a dominant factor in creating good entries and good exits. You can take your time with good-til-cancelled limit orders for entries, but in the event that you want a rapid exit on good terms, liquidity is a must.
Persistent trailing stop loss orders are an important risk management tool to limit losses while letting profits run. However, since stop loss orders convert to market orders when triggered, you don’t want to be a significant fraction of the daily volume with a market order.
There is likely to be some execution slippage from the stop trigger price to your market order trade, but in a thinly traded stock that slippage could be substantial, particularly if it occurs on a major down draft day – or heaven forbid, on a day like those we say in October 2008.
Simply low Bid-Ask spreads and frequent trades during the day are not sufficient to define liquidity. That may be so for small positions, but what about for large positions? Liquidity is total volume relative to the size of your position.
Here is a view of the average daily Dollar trading volume for the financial stocks ETFs.
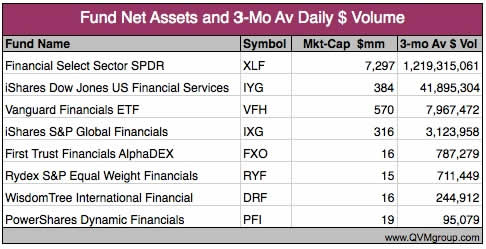
XLF, IYG, VFH and IXG each trade more than $1 million per day. XLF trades more than $1 billion per day. Clearly, they are in a different league than the others. How do those trading volumes relate to investor positions of various sizes?
Here is a view of the percentage of average daily Dollar trading volume for each fund for positions that represent 1% of the equity allocation of portfolios with $1 million, $5 million and $25 million in equities.
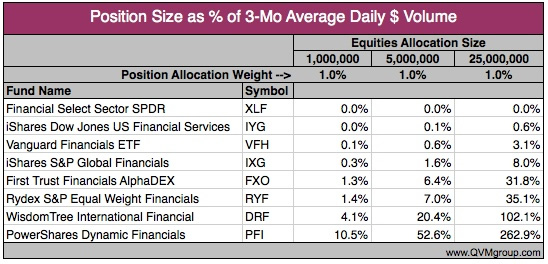
We tend to think that ½% or less of the average daily Dollar volume is a good place to be in any one position. With that guideline, XLF, IYG, VFH and IXG work for all investors with $1 million or less in equities with a 1% allocation of equities to the materials fund.
For the $5 million equities allocation, only XLF and IYG work, with IXG just over the guideline. We might stretch our guideline if we really wanted the global exposure of IXG, or we might own XLF or IYG and a few of the individual non-US banks for a global exposure. Complexity, monitoring, management effort and diversification might be reasons to stay with funds, however.
For the $25 million equities allocation, only XLF works within the guideline. Just imagine the trap that large investor would discover, if that 1% position were in FXO at 32% of a day’s volume. A market order would be savaged, and possibly not completed in a day.
Expense Ratio:
Once you have identified funds within a category with acceptable liquidity, you might be well served by tilting toward those with lower expense ratios – not necessarily the lowest, but generally not the highest either.
Here are the expense ratios for the nine materials funds.
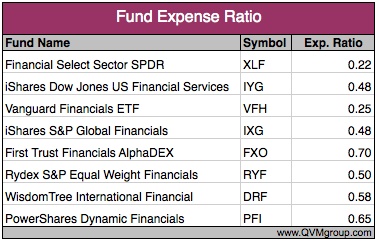
Fortunately, and not entirely surprisingly, the four most liquid funds also have the four lowest expense ratios. OK, that works. Let’s move on to yield.
Dividend Yield:
To the extent that you want total return to come from dividend yield, it’s a good idea to see how yields compare. Of course, all things being equal, lower expense ratios result in higher fund dividends and higher total returns. Then too, differences in portfolio composition can result in material differences in dividends. As conservative investors who like to receive a share of the cash flow within our portfolio holdings, we think yield inspection is an important part of fund selection within a group or category.
Here is the trailing 12-month yield for the nine materials funds.
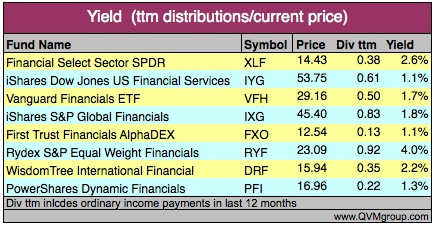
XLF has substantially higher trailing yield than IYG VFH and IXG. In addition to higher yield, XLF is (as you will see later) more concentrated in the big banks, which some believe have taken their big earning and asset hits already. IYG and VHF, on the other hand, are far more diversified with medium size banks, which may have relatively more exposure to the commercial real estate market problems that lie ahead.
As we have reported before, yield is a slippery concept. Data sources that purport to provide yield data on the same basis often have significantly varying numbers (perhaps due to “as of” date), and not all data sources use the yield definition (e.g. trailing, SEC, current, or annualized last payment as examples). Then some sources simply don’t give clear information about their method or “as of” date. So let us not be guilty of those terrible data offenses.
This table details our method and data. We went to the sponsor site for each fund and tabulated all of the actual per share ordinary income distributions for each fund over the most recent 12-month period working backward from the date of the last distribution. The yield in the table above is the result of dividing the total 12-month dividends from the table below by the most recent price (12/31/09) for the each fund.
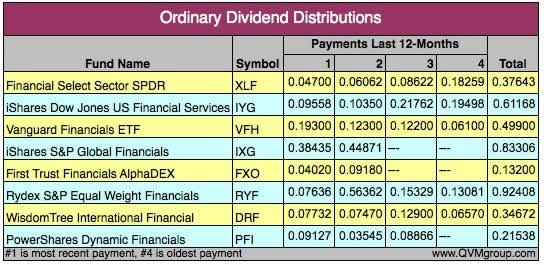
Yield Trend:
As well as yield, it can be helpful to inspect the yield trend. This may be particularly important after a turbulent year or two, such as the ones we have just been through.
In this table, we show the 2009 and 2008 distribution amounts for each distribution period (the periods vary in length and number by fund). We then computed the year-over-year change for the most recent dividend payment and for the two most recent calendar years.
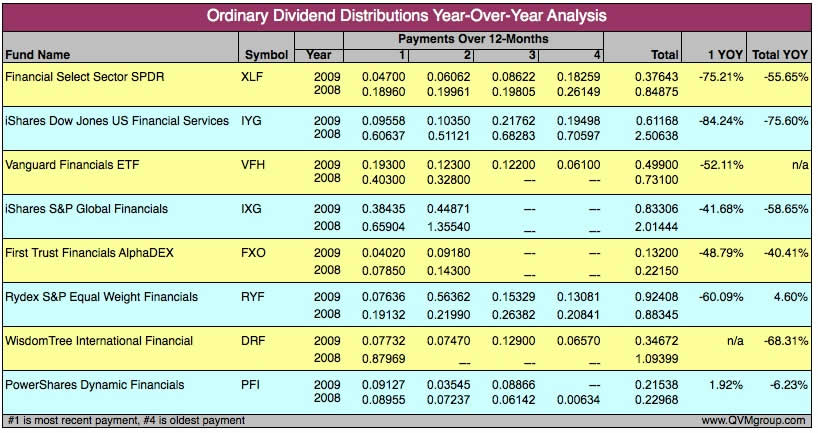
Of the four funds that made it through our filter here, all paid substantially less in dividends in 2009 than in 2008. If the world economy continues to improve, and as they repay their TARP loans and seek public acceptance of executive compensation, they would probably increase their dividends, with the prospect of going forward yields substantially higher than the trailing 12-month level.
The dividend payouts were generally cut by 50+% to 80+% in 2009 over 2008, leaving lots of room for improvements. Old payouts may be a long way off, but resumption of dividends by those who stopped, and increases by those who reduced, are not out of the question.
The domestic US financial funds show a worsening payment pattern, with the most recent payment YOY more depressed than the 12-month YOY payment. However, IXG (a global selection of financial companies) shows a less depressed last payment YOY than 12-months YOY. It’s still way down, but appears to be moderating and turning up slightly.
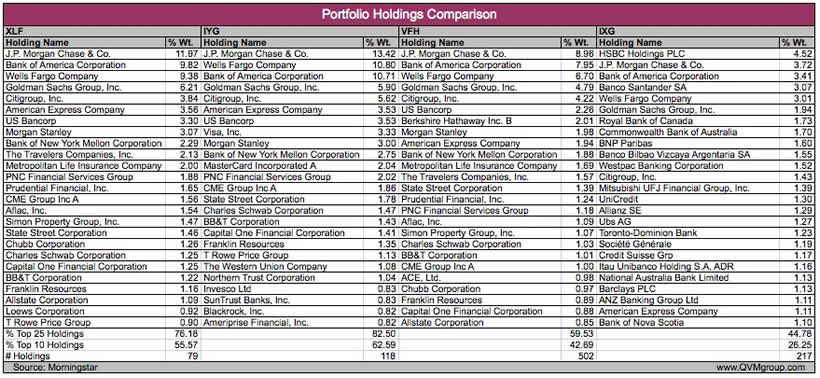
Portfolio Holdings:
Given the differences in dividend distribution patterns, let’s take an overview look at the top holdings in each of the four “qualified” funds.
A few basic observations are that XLF is the most concentrated and least diversified, with IYG and VFH successively less concentrated and more diversified. IXG is less diversified than IYG and VFH, but much more diversified than XLF.
XLF is limited to financial companies within the large-cap S&P 500, whereas IYG and VFH are not limited in that way. IXG includes non-US holdings, whereas the XLF, IYF and VFH hold only US positions.
There is high overlap among top positions between XLF, IYG and VFH.
Here is a table of the top 25 holdings for each fund.
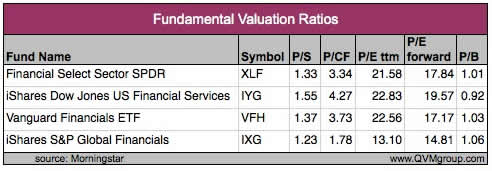
Fundamental Valuation Ratios:
The funds look similar in terms of traditional fundamental valuation ratios, with the global portfolio of IXG looking more attractive from a valuation perspective (growth factors not examined or considered in this statement, but you should look at that too).
Here is a table of price-to-sales, price-to-cash flow, price-to-trailing earnings, price-to-forward earnings, and price-to-book for the four funds that passed the earlier screens.
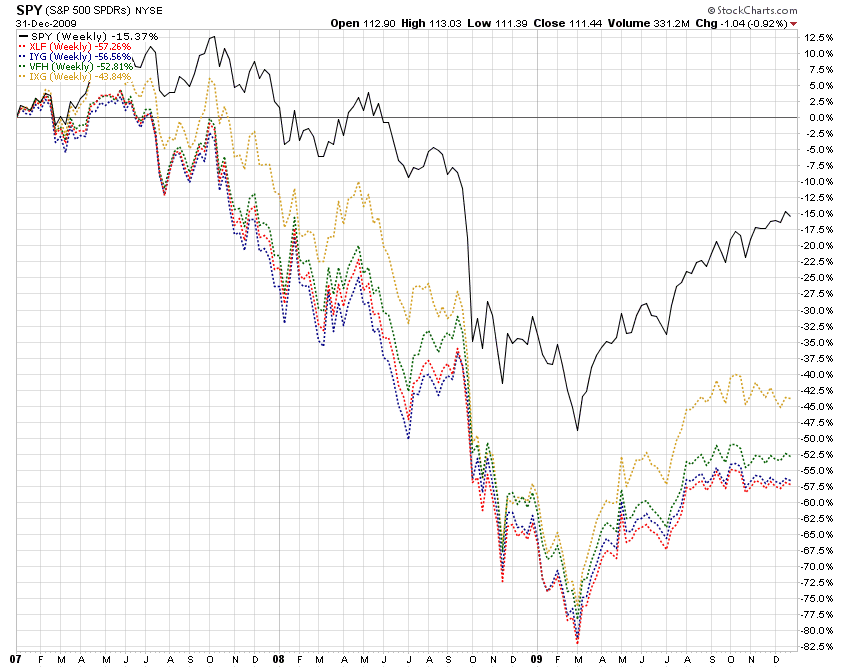
Price Return:
Among the fours favored funds, the price charts show IXG has been turning in stronger price returns over 1 and 3 years, compared to the domestic funds.
1 Year
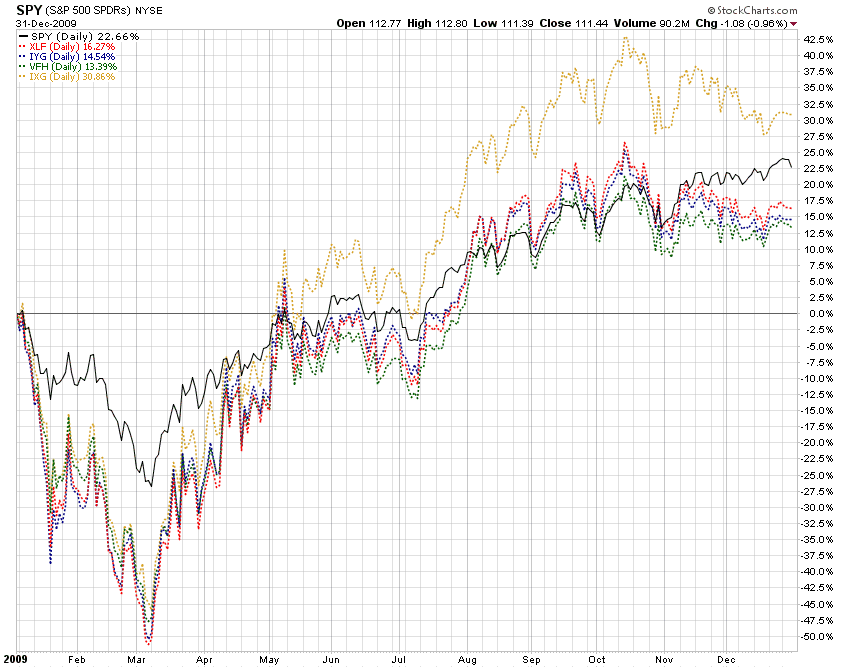
3 Years
The price return charts for the other funds shows higher 1-year returns at the best, but the liquidity is so low that those returns are not accessible by accounts with the position sizes we discussed above.
1 Year
Volatility of Diversified Funds Versus Individual Stocks:
While it may be appealing to pick individual stocks over diversified funds (because funds have some of the best and some of the worst and many average stocks), if you don’t pick the correct individual stocks you will not outperform the diversified funds.
Perhaps more important for those investors who are withdrawing assets to support lifestyle, who cannot tolerate high volatility due to the damaging effect of fixed amount withdrawals against a variable value portfolio; please do consider how much more uncertain and volatile individual stocks (particularly banks stocks these days) are versus a diversified fund.
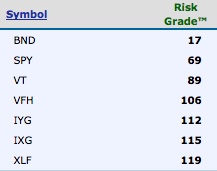
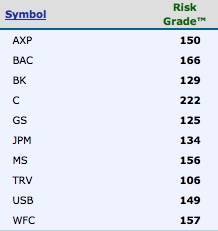
To demonstrate this point more clearly, here are two tables from RiskGrades, who rate stocks and funds for volatility versus a global basket of equities. A rating of 100 is for volatility equal to the global basket.
You can see that the funds are more volatile than the global basket, but the top ten holdings of XLF are much more volatile than XLF itself.
This demonstrates the principle that a basket of volatile stocks is less volatile than the average volatility of the individual stocks. Diversification dampens volatility.
If you seek or can tolerate volatility, perhaps buy individual stocks. Otherwise buy diversified funds; unless you have enough money, time and energy to build and manage your own diverse portfolio.
Conclusion:
For very large accounts, we would own XLF, and perhaps supplement with positions in some individual non-US financial stocks for international exposure. For accounts sizes that work from a liquidity perspective, we would own XLF and IXG for global exposure, and if the account were small enough we might own IXG alone.
Final Thought:
Assuming you make reasonable selections of individual stocks and/or funds, the primary driver of your long-term returns (perhaps 90% according to some studies) may be your allocation among key asset categories, while security selection among choices within asset categories may generate only 10% or less your total return.
Certainly, strive to make the best security choices, but do not overlook the overwhelming importance of allocation among asset categories — and don’t sacrifice critical liquidity in security selection.
Compliance Disclosure:
We own XLF in some, but not all managed accounts, and do not currently own any other funds discussed in this article. We are a fee-only investment advisor, and are compensated only by our clients. We do not sell securities, and do not receive any form of revenue or incentive from any source other than directly from clients. We are not affiliated with any securities dealer, any fund, any fund sponsor or any company issuer of any security. This report is for informational purposes only, and is not personal investment advice to any specific person for any particular purpose. We utilize information sources that we believe to be reliable, but do not warrant the accuracy of those sources or our analysis. Past performance is no guarantee of future performance. Do not rely solely on this research report when making an investment decision. Other factors may be important too. Consider seeking professional advice before implementing your portfolio ideas.
By Richard Shaw
http://www.qvmgroup.com
Richard Shaw leads the QVM team as President of QVM Group. Richard has extensive investment industry experience including serving on the board of directors of two large investment management companies, including Aberdeen Asset Management (listed London Stock Exchange) and as a charter investor and director of Lending Tree ( download short professional profile ). He provides portfolio design and management services to individual and corporate clients. He also edits the QVM investment blog. His writings are generally republished by SeekingAlpha and Reuters and are linked to sites such as Kiplinger and Yahoo Finance and other sites. He is a 1970 graduate of Dartmouth College.
Copyright 2006-2010 by QVM Group LLC All rights reserved.
Disclaimer: The above is a matter of opinion and is not intended as investment advice. Information and analysis above are derived from sources and utilizing methods believed reliable, but we cannot accept responsibility for any trading losses you may incur as a result of this analysis. Do your own due diligence.
Richard Shaw Archive |
© 2005-2022 http://www.MarketOracle.co.uk - The Market Oracle is a FREE Daily Financial Markets Analysis & Forecasting online publication.