


Gold Bullish Developments Could be Blown by Falling Channel
Commodities / Gold and Silver 2010 Apr 06, 2010 - 01:14 AM GMT

 As discussed in these reports and elsewhere, all eyes have been focused on Greece's sovereign debt problems. As I have repeatedly said - this is but the tip of an iceberg of global proportions.
China's debt may reach 39.83 trillion Yuan ($5.8 trillion) next year. The International Monetary Fund estimates that China's debt-to-GDP ratio is 22%, which excludes local-government liabilities.
The IMF has Spain at 69.6%, the U.S. at 94%, and Greece at 115%, with Japan winning first prize at a whopping 227%. Japan's total public debt is fast approaching the value of household wealth, which suggests serious problems for the government bond market.

Professor Victor Shih's research into China's local government funding costs, which were not included in the "official" IMF report, estimates that China's government debt could reach 96% of gross domestic product next year, increasing the risk of yet another financial crisis.
According to Moody's, the U.S. government will spend about 7% of its revenue servicing its debt in 2010 and 11% in 2013, based on a moderate economic recovery, fiscal adjustments the government plans on implementing, and a gradual increase in interest rates.
If, however, there is lower growth than projected, coupled with less fiscal adjustment and higher interest rates, the U.S. could be paying 15% of revenue in interest payments that would lead to a downgrade of U.S. sovereign debt by Moody's.
It appears there is more than one *****-roach hiding beneath the rubble of structured finance - waiting to crawl out into the light of day, exposing the world's dysfunctional paper fiat monetary system for the travesty it is.
Bonds
Recall in the above economic section of this report that two scenarios were given for U.S. sovereign debt service (interest rates). One was based on a "Goldie Locks" scenario where all things are sugar & spice; and the second was based on Murphy's Law: "anything that can go wrong will go wrong". Well, lately interest rates have been rising in the U.S., and fairly significantly so. This week was no different.
Two year government rates increased 6 basis points to 1.02%. Five year yields added 8 bps to 2.60%. Ten year yields surges 10 basis points to end the week at 3.95% (nearing the important 4% level). And the long bond increased 4.3 bps to 4.73% (closing in on the crucial 5% rate). Of interest: Greece's sovereign debt yields surged 33 bps to 6.52%, compared to German rates that fell 7 bps to 3.08%, leaving the spread at 344 bps or twice the Germany's rate. 30 year fixed mortgage rates issued by Freddie Mac added 9 basis points to a 12 week high 5.08%.
As I wrote in last week's report, interest rates are rising in the U.S. because investors are well aware of the huge supply of debt the Treasury needs to sell to fund the deficits and other bailout schemes. Investors are demanding higher interest to compensate for the added risk - the risk of price depreciation and perhaps even default, just as Greece is experiencing.
A paper fiat monetary debt system has the seeds of self-destructing built within. 30 year Treasury yields peaked at 14% in 1981 and then began a long decline into its 2008 financial panic low near 2.6%. From there rates have rebounded to present levels, as prospects for the economy and the markets increased.
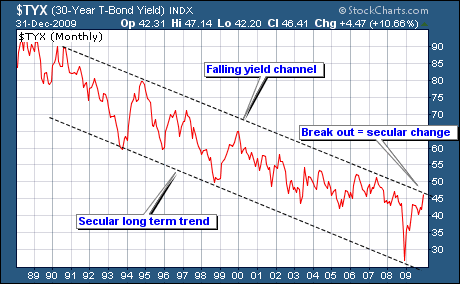
As I have said for months: the next bubble to pop could be the bond bubble, aka: the Greenspan put, which was the main reason why China & Japan funded our national debt.
If 30 year yields break above, and hold, the 4.75% level, it will mean that a secular change of higher rates is unfolding.
This would be a major event that the markets are NOT prepared for; and will have dire consequences if it occurs.
The chart below shows 10 year yields approaching overhead resistance near 4% that goes back to 2008. Yields have already far surpassed the 62.8% Fibonacci retracement level, suggesting that the highs will be tested and broken.
The chart pattern also resembles a cup & handle formation that if confirmed gives an upside projection for rates near 6% on an intermediate term basis. The monthly chart gives even higher yield targets.
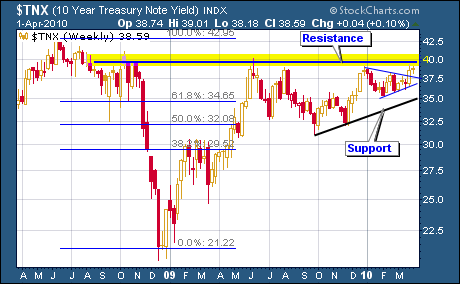
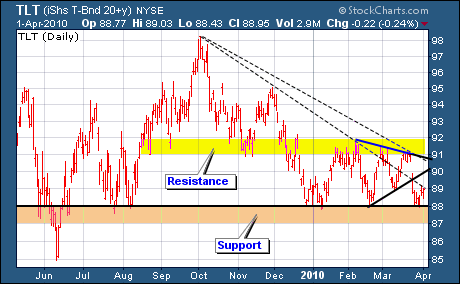
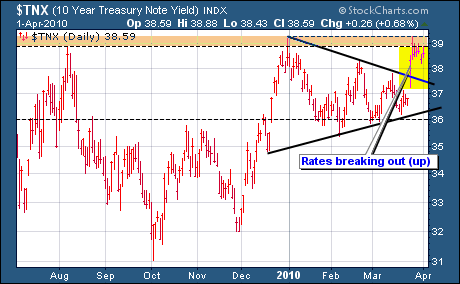
Above: TLT (20 yr. bonds) breaking below lower trend line and bouncing of horizontal support. Below: TNX (10 yr. yields) breaking out and bumping into overhead resistance at 3.9%.

Gold
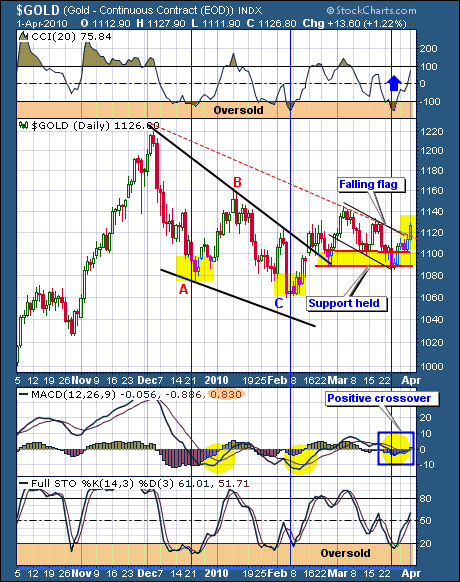
Gold was up $19.70 to close at $1126.80 for a weekly gain of +1.78%. In last week's report (3/26/10) I stated that it was encouraging to see gold hold positive territory while the dollar was up over 1%, and that price was testing important support going back to its earlier March low and its Feb. breakout from the falling wedge pattern.
Although in last week's report, prices had remained little changed from the previous week (3/19/10), intra-week gold had tested its lows, which held.
With Friday's (3/26/10) long white candlestick, as discussed in last week's market wrap, the weight of the evidence had shifted from negative back to even. This was positive price action, but required further confirmation.
Last week's reported stated that the daily chart showed gold was oversold, according to both CCI and STO readings. The CCI indicator had moved from below -100, to just above this trigger level, and was sitting at -75 on last Friday's (3/26/10) close.
I pointed out that if one followed the blue vertical lines on the chart that they connected past CCI signals with subsequent price rallies and oversold STO readings at the bottom of the chart.
It was further stated that for these buy signals to be valid that STO needed to move from below 20 to above; and that both the CCI & STO signals need to be confirmed with a positive MACD crossover.
As the chart below shows, STO turned up and through the 20 zone this past week and is now above 50; AND MACD made a positive crossover.
Price has broken out of its falling flag formation AND above its falling trend line extending down from its Dec. high. The chart has turned decidedly bullish if price holds the breakout.
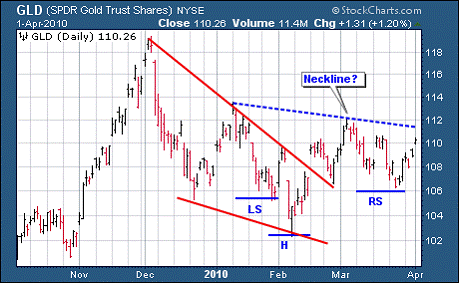
And there is further potential. A few weeks ago I mentioned that gold appeared to be in the process of forming an inverse head & shoulders formation. To quote from the 3/19/10 market wrap report:
It shows the breakout of the falling wedge pattern. The breakout has formed its own triangle pattern, and is presently testing its bottom support line. Notice the inverse head & shoulders pattern that has been developing. Until Friday's steep drop, this looked like a pretty viable scenario. But Friday's drop brings it seriously into question. It has to reverse immediately or it's dead in the water. However, IF (?) price does bounce and reverse off support, then the pattern would be alive again. To confirm the pattern, a breakout on expanding volume above the neckline is needed.
So far, GLD has reversed from 106 to 110. A breakout above the neckline would take place around 111.50 - not far away, but we ain't there yet. Most importantly: it will need to occur on expanding volume AND resistance must turn into support.
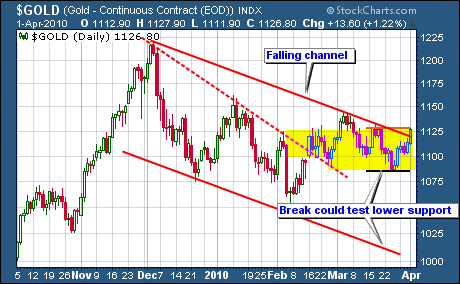
Now, before getting too carried away with the bullish case for gold, I like to look at what could go wrong and blow my entire premise out of the water. Here's one possibility - there are others.
Notice that gold has formed a falling price channel: a series of lower highs and lower lows. The recent higher low, if it holds, breaks the lower low half of the equation.
Next, we need a break above the March high, and preferably the Jan. high, to break the series of lower highs. A break below the March low would lead to a test of the Feb. low, and or the $1000 price level.
The above is a small excerpt from the full market wrap report, which covers all the markets: stocks, bonds, currencies, commodities, gold & silver, and the precious metal stocks. Each weekly report contains dozens of charts and graphs, our stock watch list, and model portfolio.
Stop by and check out our FREE one month trial subscription and this week's report which highlights the breakout in gold & silver and the pm stocks.
Good Luck. Good Trading. Good Health. And that's a Wrap.
Good luck. Good trading. Good health, and that’s a wrap.

Come visit our website: Honest Money Gold & Silver Report
New Audio-Book Now Available - Honest Money
Douglas V. Gnazzo
Honest Money Gold & Silver Report
About the author: Douglas V. Gnazzo writes for numerous websites and his work appears both here and abroad. Mr. Gnazzo is a listed scholar for the Foundation for the Advancement of Monetary Education (FAME).
Disclaimer: The contents of this article represent the opinions of Douglas V. Gnazzo. Nothing contained herein is intended as investment advice or recommendations for specific investment decisions, and you should not rely on it as such. Douglas V. Gnazzo is not a registered investment advisor. Information and analysis above are derived from sources and using methods believed to be reliable, but Douglas. V. Gnazzo cannot accept responsibility for any trading losses you may incur as a result of your reliance on this analysis and will not be held liable for the consequence of reliance upon any opinion or statement contained herein or any omission. Individuals should consult with their broker and personal financial advisors before engaging in any trading activities. Do your own due diligence regarding personal investment decisions. This article may contain information that is confidential and/or protected by law. The purpose of this article is intended to be used as an educational discussion of the issues involved. Douglas V. Gnazzo is not a lawyer or a legal scholar. Information and analysis derived from the quoted sources are believed to be reliable and are offered in good faith. Only a highly trained and certified and registered legal professional should be regarded as an authority on the issues involved; and all those seeking such an authoritative opinion should do their own due diligence and seek out the advice of a legal professional. Lastly Douglas V. Gnazzo believes that The United States of America is the greatest country on Earth, but that it can yet become greater. This article is written to help facilitate that greater becoming. God Bless America.
Douglas V. Gnazzo © 2010 All Rights Reserved
© 2005-2022 http://www.MarketOracle.co.uk - The Market Oracle is a FREE Daily Financial Markets Analysis & Forecasting online publication.