


Indian Stock Market Detailed Technical Analysis with Chart studies
Stock-Markets / India May 15, 2010 - 08:26 AM GMTBy: StocksBuddy

 As stated in our analysis from previous analysis, market did rally back from the oversold levels. Though market did bounce back, it once again found resistance at the center line of BB which runs around 5200. Market took cues from global rally and echoed the same here. However, towards the end of the week, all the enthusiasm waned. EUR, got a facelift on monday with a $1trillion bailout in Europe. However, it gave up all of the gains from monday and actually has broken down big time during the week.
US markets too ended up on a sour note on friday and Asia is expected to open flat to negative on monday because of this.
A lot of action took place last week.
As stated in our analysis from previous analysis, market did rally back from the oversold levels. Though market did bounce back, it once again found resistance at the center line of BB which runs around 5200. Market took cues from global rally and echoed the same here. However, towards the end of the week, all the enthusiasm waned. EUR, got a facelift on monday with a $1trillion bailout in Europe. However, it gave up all of the gains from monday and actually has broken down big time during the week.
US markets too ended up on a sour note on friday and Asia is expected to open flat to negative on monday because of this.
A lot of action took place last week.
Nifty once again found support outside of the lower Bollinger bands. Each day nifty went down, it had a long hammer. This clearly suggests that nifty does not really want to go down, but is going down because of reasons beyond it's control, viz. global conditions. This shows the relative strength of nifty. The question everyone has been asking is whether this is just a minor correction or is it start of a new downtrend. Looking at weekly chart, it doesn't bode well with Bulls right now as we have a "Shooting Star". Good news in this bad one is that nifty closed positive for the week.
Nifty once again found support outside of the lower Bollinger bands. Each day nifty went down, it had a long hammer. This clearly suggests that nifty does not really want to go down, but is going down because of reasons beyond it's control, viz. global conditions. This shows the relative strength of nifty. The question everyone has been asking is whether this is just a minor correction or is it start of a new downtrend. Looking at weekly chart, it doesn't bode well with Bulls right now as we have a "Shooting Star". Good news in this bad one is that nifty closed positive for the week.
Technically Speaking:
Take a look at the Daily Nifty chart below.
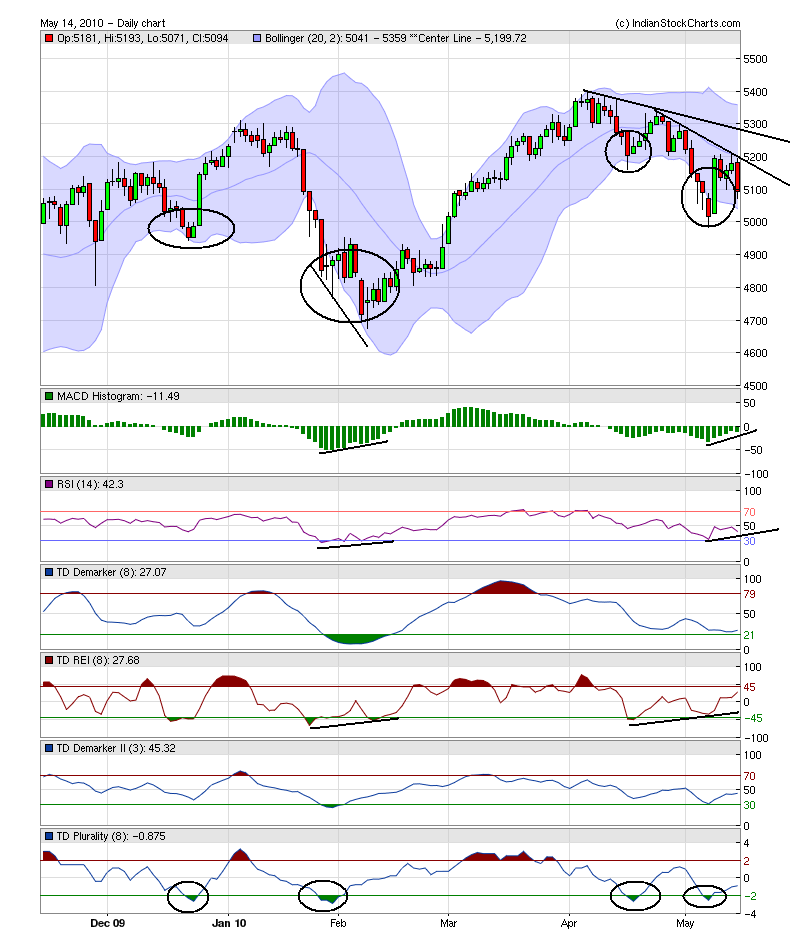
The above chart uses TD Demark indicators extensively. Positives:
- Looks like a bottoming process.
- RSI going down the hill and pretty fast. However, we may be pretty close to a bottom as it forms a divergence.
- MACD too is pretty much similar to RSI and is potentially in the process of making a positive divergence.
Next Week:
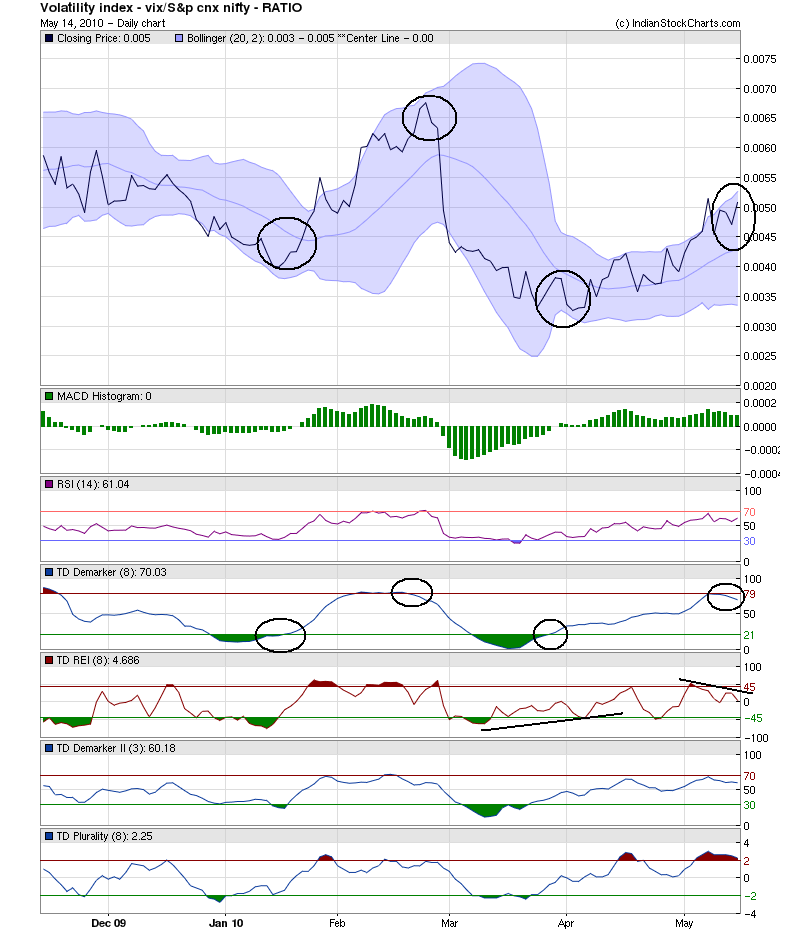
As we stated in our previous commentary, things are extremely messed up and nothing is really clear as to which way things are going to go. In the above chart, we have drawn some trendlines that are very important to look out for, viz. 5200 and 5275 (as of this writing). Once nifty crosses these two, then we will see new highs or at least a test of 5400. The chart below is the ratio chart of Indian VIX (Volatility index) to Nifty. This chart shows the correlation between Volatility and the moves in Nifty. The lower this chart, the higher the chances for Nifty to move up and vice-versa. This chart is in a very strong uptrend, meaning lower prices for nifty ahead of it. However, if you notice TD Demarker (circled below) each time it touched 80 and started trending lower, it market a short term top. Likewise, TD REI has had clear divergence before we noticed a move one way or the other.
More detailed analysis for Subscribers includes Analysis on NIFTY McClellan Summation Index, Number of stocks and their Moving Averages and Next Week Trading (Bullish/Bearish), detailed bullish/bearish table analysis. For subscriptions, please Click Here.
Have a Wonderful Trading Week ahead.
Regards
Disclaimer: At the time of this writing, neither the authors nor our team held any positions on any securities unless otherwise explicitly stated. All information above is only for educational purposes and you are responsible for your own actions.
India's No.1 Trading Community From the desk of StocksBuddy.com Analysts comes the above article. SB Analyst team comprises of experts from varied fields such as Technical Analysis, Fundamental Analysis, Macro-Micro Economics, World Affairs, Currency and much more. Apart from user contributions, our analysts post analysis on StocksBuddy.com on a regular basis. For more details, please visit us @ http://www.stocksbuddy.com/blogs
© 2009 Copyright StocksBuddy - All Rights Reserved
Disclaimer: The above is a matter of opinion provided for general information purposes only and is not intended as investment advice. Information and analysis above are derived from sources and utilising methods believed to be reliable, but we cannot accept responsibility for any losses you may incur as a result of this analysis. Individuals should consult with their personal financial advisors.
© 2005-2022 http://www.MarketOracle.co.uk - The Market Oracle is a FREE Daily Financial Markets Analysis & Forecasting online publication.