


A Stock Technical Trading Tip You Can Use ...
Stock-Markets / Stock Markets 2010 May 28, 2010 - 11:40 AM GMTBy: Marty_Chenard

 The markets will be closed on Monday for the Memorial Day Holiday. Some of you may want to play around with charts over the weekend, so I will leave you with a technical tip.
The technical tip involves the use of two different Relative Strength numbers used simultaneously ... a daily Relative Strength number of 9 and the other set at 30.
As you know, I dislike indicator readings when they go from 0 to 100 because your mind has to be engaged to "read" them. I have always felt that a neutral reading of 50 on the RSI should be expressed as 0 which is clearly a neutral number that needs no interpretation. Likewise, the indicator should either clearly read POSITIVE or NEGATIVE.
This is why I have recreated the RSI as a zero based indicator. You can do the same by simply creating a new indicator that takes the old RSI and subtract the number 50 from the readings. Today's C-RSI chart shows you what the result looks like for a RSI of 9 and 30.
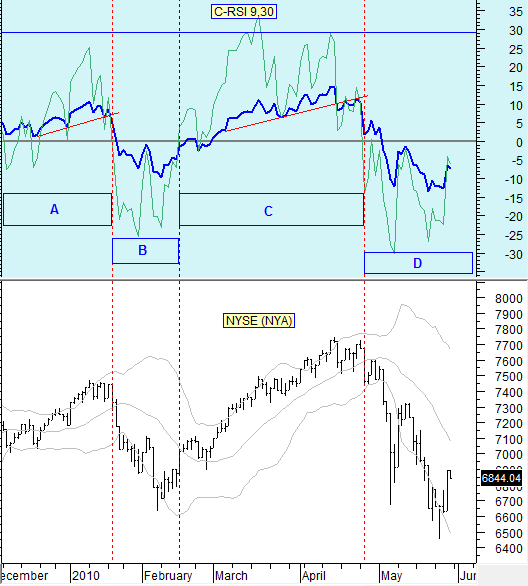
Let's now move on to the tip phase of today's update. I had mentioned earlier, that you want to plot the 9 and 30 RSI simultaneously on the same chart. Below is today's chart going back to last December.
Conditions that matter: 1. For the 9 RSI to be positive or negative. 2. To notice if the 30 RSI is positive or negative while the 9 RSI may be oscillating above or below neutral. 3. For the 9 RSI to be trending above or below the blue RSI 30 line.
Let's take a look at today's chart. Notice that I have labeled four rectangular boxes from A to D. These areas depict times of signal changes using these two indicators.
Let's start with area A. In that time frame, we have the 30 RSI positive and trending up the entire time ... that is a positive market bias condition. The green line showing the 9 RSI started off by oscillating above and below the zero line ... while the 30 RSI had a positive bias. Note that the 9 RSI, even though oscillating, was in a technical up trend because it was making higher/highs and higher/lows. Finally, toward the end of the move, the 9 RSI reversed its trend because it started to make lower/tops and lower/bottoms. After that warning, the 9 RSI went negative at the red vertical line and the 30 RSI broke its red support line. That started the down condition. (Area C is similar, but a little more complex because the 9 RSI down trended and then re-trended up. While it did so, the 9 RSI remained above the 30 RSI which was bullish. The C move finally broke its red line support on the 30 RSI and then the 9 RSI when negative afterwards. That started the down trend we just experienced.)
Now, let's look at areas B and D. In the B area, the 30 RSI went negative with the 9 RSI staying negative until it crossed over positive at the blue vertical line. That ended the down trend, because the 30 RSI followed by going positive and up trending by making higher/highs and higher/lows.
So now we are at area D. Both the 9 and 30 RSI are in negative territory. But what else can you notice now? For one thing, the 9 RSI just made a higher/low so that COULD be the start of it changing to an up trend. To do so, the 9 RSI will need to make a higher/high which it did not do at the close on Thursday.
So, that is one of the things you want to look for. The other, is for the 9 RSI to move above the zero line and go positive ... and then to be followed by the 30 RSI in making higher/highs and higher/lows.
By the way, even though the 9 RSI has not made a higher/high yet, it did do something that was positive and worth noting. What was it? The green 9 RSI closed above the blue 30 RSI which showed an 9 to 30 RSI strength improvement.
Technical analysis can be learned by anyone, but it can take a lot of time to do. I start at 5:30 AM everyday day, so I can attest to how much work it is. In today's environment, it is also beneficial to buy unusual data streams not available to the investing public ... such as the Institutional raw data we purchase. Some investors like to do all of this for themselves, and others like to subscribe to a service like ours and let us do all the work. In any case, one of the most important things an investor can do, is to continue to learn new things because the market is always changing and it always leaves the non-learners behind as it move forward.
** Feel free to share this page with others by using the "Send this Page to a Friend" link below.
By Marty Chenard
http://www.stocktiming.com/
Please Note: We do not issue Buy or Sell timing recommendations on these Free daily update pages . I hope you understand, that in fairness, our Buy/Sell recommendations and advanced market Models are only available to our paid subscribers on a password required basis. Membership information
Marty Chenard is the Author and Teacher of two Seminar Courses on "Advanced Technical Analysis Investing", Mr. Chenard has been investing for over 30 years. In 2001 when the NASDAQ dropped 24.5%, his personal investment performance for the year was a gain of 57.428%. He is an Advanced Stock Market Technical Analyst that has developed his own proprietary analytical tools. As a result, he was out of the market two weeks before the 1987 Crash in the most recent Bear Market he faxed his Members in March 2000 telling them all to SELL. He is an advanced technical analyst and not an investment advisor, nor a securities broker.
Marty Chenard Archive |
© 2005-2022 http://www.MarketOracle.co.uk - The Market Oracle is a FREE Daily Financial Markets Analysis & Forecasting online publication.