


Confirming the Stock Market Flash Crash Omen
Stock-Markets / Financial Crash Jun 04, 2010 - 02:38 PM GMTBy: Gordon_T_Long

 The highly discussed and quickly forgotten Flash Crash was an omen of what lies ahead for the financial markets. It was a uniquely distinctive occurrence relative to anything we’ve ever experienced. Likewise, what we are about to witness will be startling and never before observed by this generation of investors. After only thirty days the Flash Crash signal has become unambiguous and historians will wonder why the public didn’t react sooner to its clarion call.
 Prior to the May 6th Flash Crash I laid out what to expect in “Extend & Pretend: Shifting Risk to the Innocent”. The ink was barely wet before its predictions began to rapidly unfold. The basis for the predictions was the similarities between the rally we have experienced since March 2009 and the rally prior to the 1987 crash. It was striking in comparison to the amount of rise, the rate and the pattern, but more importantly the reason for both rallies. The 1987 crash was attributed to Portfolio Insurance. In 2010 it’s about what is referred to as the ‘son-of-portfolio insurance’ or Dynamic Hedging.
Over the last ten years we’ve systematically accelerated the shifting of risk through the advancement of three new strategies; Dynamic Hedging, Capital Arbitrage and Regulatory Arbitrage. Individually they may seem sound but when pyramided as we have done over this period of time, they set the stage for systemic instability. The underlying bedrock of this shaky pyramid is Dynamic Hedging.
For the full research paper: see TIPPING POINTS
The three new strategies:
Dynamic Hedging
Reduces Risk further through recent advancements in High Frequency Trading and Dark Pools (1)
Capital Arbitrage
Hides Risk by removing it from financial balance sheets
Regulatory Arbitrage
Moves Risk to Sovereign entities.
I won’t explore in this article how these strategies are being used and how they are building upon themselves (see “Extend & Pretend: Shifting Risk to the Innocent”) but rather I want to focus on what the Flash Crash is signaling and how it relates to the three critical flaws of all modern trading algorithms.
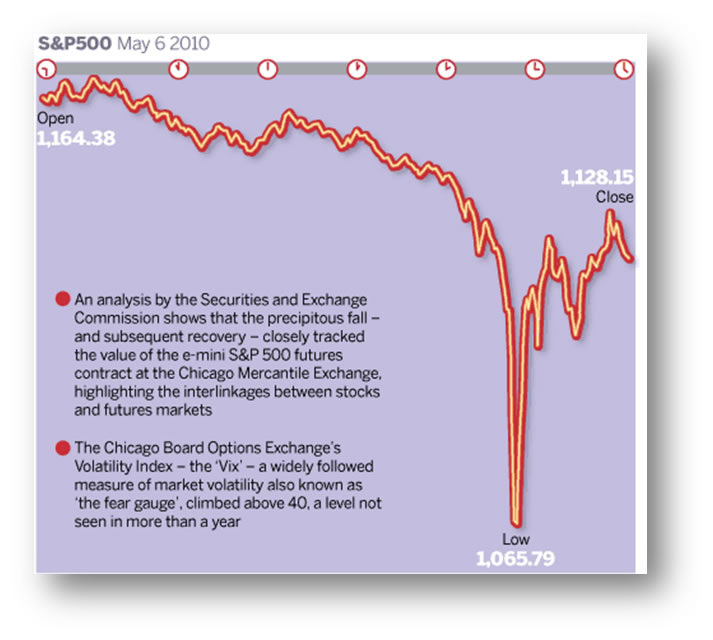
The chart above and the May 17th Wall Street Journal confirmed the rational for our April predictions:
On May 6, "The velocity of the volatility was stunning, beyond anything I had ever seen, with the exception of October of 1987, when I was on the trading floor," said Ted Weisberg, president of Seaport Securities in New York. "There's a strong parallel between the Black Monday crash and the flash crash," said Michael Wong, an analyst at Morningstar who tracks stock exchanges. On Oct. 19, 1987, the Dow Jones Industrial Average tumbled more than 20%, and the swoon extended into the following day, before a rebound. Floor traders, working by telephone, dominated the action and computer-generated trading was still in its infancy. Dark pools and high-frequency trading were the stuff of science fiction. Trading reached 600 million shares, according to the SEC.
Fast forward to May 6, 2010: The worst part of the lightning descent lasted roughly 10 minutes and the decline hit 9.8% at its worst. Trades, many executed in milliseconds, reached 19 billion shares. In both cases, troubles first appeared in the stock futures market, which precipitated a decline in the regular "cash" market. The two created a feedback loop, dragging both markets lower. Perhaps the most concerning parallel was how professionals abandoned the market. In 1987, some human market-makers on the floor of the exchange stopped providing bids for certain stocks.
Two decades later, in a market dominated by technology, high-speed traders who often provide liquidity for the market, just switched off their computers. Other big players, including fast-trading hedge funds, also pulled out of the market, according to traders and exchange officials.
"Go back to the 1987 crash, every major firm pulled out," said Chris Concannon, a senior partner at Virtu Financial LLC, a New York electronic market making firm, which continued trading during the May 6 turmoil. "In every break you find evidence of major firms withdrawing their buying and selling interest from the market." (2)
The Financial Times on June 1st wrote:
Traders were stunned. “We thought a big European bank was about to go under, that this was it,” says a dealer who was on one of the big trading floors at the time. “Everyone got on the phone. Then, traders quickly realised that the falls were due to lots of automated sell orders. At that point we all just wanted to reach for the emergency button and press stop.” While there have been times in equity markets where some stocks have moved wildly, the afternoon that has become known as the “flash crash” was the first time that the entire US equity market was convulsed by such turmoil. But 20 minutes later prices had bounced back. Trades that took place during that dramatic slice of the hour where the movement was more than 60 per cent were cancelled. Yet the impact of the flash crash will be felt for a long time to come, not least because it showed that the equity markets do not have such an emergency button, or any way to halt trading when something goes haywire. (3)
MESSAGES OF THE FLASH CRASH:
Liquidity Driver
Dynamic Hedging and Portfolio Insurance are both based on trend following mechanics. Consequentially both have a strong bias towards momentum correlation and the ability to adjust to changes in momentum.
One of three flaws in most mathematical algorithms is the assumption of market liquidity. When markets breakdown, liquidity quickly evaporates and this often makes execution impossible. The more serious the breakdown the more serious the liquidity problem will become. Also, the liquidity issue is often simultaneously seen across multiple markets where modern dynamic hedging operates.
The Flash Crash confirmed that Dynamic Hedging has now been modified by major players to take this into account and this is why the algorithms ‘grabbed’ as much liquidity as fast as it could, at accelerating rates - while liquidity was still available. The employment of High Frequency Trading has now emerged as a strategic imperative within state-of-the-art Dynamic Hedging Systems.
Counter Party Risk Driver
A second flaw of trading algorithms and markets is counter party risk or the sudden failure of a counterparty to deliver a contracted obligation. With banks & financial institutions still having serious amounts of off balance sheet risk tied to Structured Investment Vehicles (SIVs) and corporations to Special Purpose Entities (SPEs) the ability to rapidly shift hedging on any early indications is now paramount.
Shifts in LIBOR, TED Spread, and OIS-Swap spread must now be acted upon in milliseconds. The Flash Crash occurred when all these input drivers were moving as a result of the Euro crisis.
Sovereign Debt
Changes in Sovereign Debt Ratings have a profound impact on collateral calls associated with the $430 Trillion Interest Rate Swap market. Collateral Calls are typically tied to Credit Ratings, LIBOR, Spreads and Asset Values. Hedge positions on Trillion Dollar portfolios must now be repositioned in minutes versus days or even hours while high volume liquidity and price is available.
Instability
A third flaw of trading algorithms is their assumption of ‘continuity’ or continuously operating markets. Instability of any system can lead to compounding results or exponential change until the function reaches a point of discontinuity. The Flash Crash was the most severe of a number of market moves lately that evidenced higher amplitudes, shorter frequencies and steeper rates of change which are signs of instability in the market.
As much as the market became fixated on the Flash Crash, what has received little attention are the dramatic “Flash Dashes” where markets on close for example are seeing 20 handles on the S&P. For long term traders these are worrying tell tales. To others they are evidence of accelerating and compounding Dynamic Hedging issue.
“The real shocker is that it was nothing nefarious that caused the crash,” says David Weild, senior adviser to Grant Thornton and former vice-chairman at Nasdaq. “It was acceptable investor behaviour – people trying to put on hedge transactions,” he believes. “The market had a mini-meltdown in an instance when it appears no one was intentionally trying to manipulate the market. It’s disturbing that it does not take a lot to cause these markets to cascade.” (3)
The flash crash confirmed the suspicions of those investors and regulators who had long worried that complicated trading systems, fragmented trading across some 40 different venues, and the enthusiastic embrace of super-fast trading with computers spitting out thousands of buy and sell orders in microseconds, could threaten disaster.
Indeed, the flash crash taps into a debate that has been simmering for years between those who see benefits created by the rapid advance of technology – by lowering barriers to entry for new participants and boosting liquidity for investors who wish to trade – and those who fear it has introduced unknown risks into the system.
The events of May 6 revealed that while getting rid of old-style “specialist” market makers has reduced the cost of trading by narrowing bid-ask spreads, the benefit has come at a cost. Now, no one has an obligation to provide prices for all shares all the time during a trading day, as trading has fragmented across an array of electronic trading venues and traders. The moment the markets grow too risky, many new electronic market makers appear only too willing to head for the exit. (3)
CATALYST
It is readily apparent that present day markets have built across-market dynamic hedging machinery with a hair trigger. This trigger is designed to launch unimaginable trading volumes in less than 250 microseconds, across global exchanges, operating under different & still uncoordinated rules. The activation could be any number of events but my sense is it will stem from the dramatic contraction in money supply. Despite massive central bank actions, money supply as measured by MZM, M1, M2 is still de-accelerating and in the case of the difficult to obtain M3, is contracting. All of which is presently going unheralded by the mainline media.
When a highly leveraged system is built on the basis of liquidity and liquidity is shrinking, it is only a matter of time.
CONCLUSIONS
Flash Crashes and Dashes will become more apparent. By their very nature they are de-stabilizing. When certain natural frequency boundary conditions are broken the markets will eventual seize up, despite all circuit breakers and attempts by authorities to stabilize markets. These boundary conditions are not presently understood nor seen to exist. For practitioners of Chaos Theory they are a basic tenet to understanding any phase shift.
We are nearing a ‘phase shift’ in what I will refer to as the energy level of the markets. Elliott Wave practitioners would refer to it as a ‘higher degree pivot’. W D Gann practitioners would call it a Gann Cardinal. Economists call it a “Tipping Point”. I call it a ‘Critical Point’ or ‘Chaotic Transient’.
A trader would just call it a market melt-down or melt-up! Few alive have ever witnessed either.
For further insight I would refer you to my previous article: EXTEND & PRETEND - Manufacturing a Minsky Melt-Up
Sign Up for the next release in the EXTEND & PRETEND series: Commentary
The previous EXTEND & PRETEND article: EXTEND & PRETEND: Its either RICO Act or Control Fraud
SOURCES
(1) 05-18-10 Financial markets regulation: The tipping point VOX
(2) 05-17-10 How the 'Flash Crash' Echoed Black Monday WSJ
(3) 06-01-10 Stock markets: That sinking feeling Financial Times
REFERENCES
Caplan, Keith, Robert P Cohen, Jimmie Lenz, and Christopher Pullano (2009), “Dark Pools of Liquidity”, PriceWaterHouseCoopers, Alternatives Newsletter.
Gorham, Michael, and Nidhi Singh (2009), Electronic Exchanges: The Global Transformation from Pits to Bits, Elsevier.
Krause, Reinhardt (2008), “Dark Pools Let Big Institutions Trade Quietly”, Investor's Business Daily.
Patterson, Scott, Kara Scannell and Geoffrey Rogow (2009), “Ban on Flash Orders Is Considered by SEC: Schapiro Sees Inequity While Exchanges Wrestle for Market Share in High-Speed Trading”, The Wall Street Journal, 5 August.
Schlegel, Kip (1993), “Crime in the Pits: The Regulation of Futures Trading, American Academy of Political and Social Science
Securities and Exchange Commission (2009a), “SEC Issues Proposals to Shed Greater Light on Dark Pools”, October 21.
Securities and Exchange Commission (2009b), “Strengthening the Regulation of Dark Pools”, SEC Open Meeting, October 21.
Younglai, Rachelle and Jonathan Spicer (2009), “US SEC says "dark pools" are emerging risk to market”, Reuters, 18 June.
Gordon T Long gtlong@comcast.net Web: Tipping Points
Mr. Long is a former executive with IBM & Motorola, a principle in a high tech start-up and founder of a private Venture Capital fund. He is presently involved in Private Equity Placements Internationally in addition to proprietary trading that involves the development & application of Chaos Theory and Mandelbrot Generator algorithms.
Gordon T Long is not a registered advisor and does not give investment advice. His comments are an expression of opinion only and should not be construed in any manner whatsoever as recommendations to buy or sell a stock, option, future, bond, commodity or any other financial instrument at any time. While he believes his statements to be true, they always depend on the reliability of his own credible sources. Of course, he recommends that you consult with a qualified investment advisor, one licensed by appropriate regulatory agencies in your legal jurisdiction, before making any investment decisions, and barring that, we encourage you confirm the facts on your own before making important investment commitments.
© Copyright 2010 Gordon T Long. The information herein was obtained from sources which Mr. Long believes reliable, but he does not guarantee its accuracy. None of the information, advertisements, website links, or any opinions expressed constitutes a solicitation of the purchase or sale of any securities or commodities. Please note that Mr. Long may already have invested or may from time to time invest in securities that are recommended or otherwise covered on this website. Mr. Long does not intend to disclose the extent of any current holdings or future transactions with respect to any particular security. You should consider this possibility before investing in any security based upon statements and information contained in any report, post, comment or recommendation you receive from him.
© 2005-2022 http://www.MarketOracle.co.uk - The Market Oracle is a FREE Daily Financial Markets Analysis & Forecasting online publication.
Comments
|
04 Jun 10, 18:19 |
Flash Crash
Your chart says Crash 2012, not 6th May 2010 |