


Stock Market Cycle Turning Points Analysis 9th Setember 2007
Stock-Markets / Cycles Analysis Sep 09, 2007 - 07:01 PM GMTBy: Andre_Gratian


Current Position of the Market
SPX: Long-Term Trend - The 12-yr cycle is still in its up-phase but, as we approach its mid-point, some of its dominant components which are topping will restrain the bullish effect of the 4.5-yr cycle which is now in an uptrend, and this could lead to another correction in 2008.
SPX: Intermediate Trend - Climactic action followed by an immediate reversal suggests that the 4.5-yr cycle has bottomed but some additional consolidation may be required before new highs are made.
Analysis of the short-term trend is done on a daily basis with the help of hourly charts. It is an important adjunct to the analysis of daily and weekly charts which determines the course of longer market trends.
Overview
The SPX saw plenty of action over the past two weeks. Since the publication of my last newsletter there has been a 46-point decline, a 64-point rally, and another 44-point decline. These were brought about by short-term cycles which, in the current volatile atmosphere, are packing a bigger punch than usual.
With some minor differences, all equity indexes have formed very similar patterns since they peaked in mid-July. The overall picture suggests that the decline made a corrective A-B-C pattern which ended in a selling climax at the 4.5-yr cycle low in mid-August, and which was followed by a strong rally. With a short-term cycle probably at or near its low, we may now be in a position to attempt a resumption of the uptrend.
The most noteworthy event of the past two weeks is that at its rally high on 9/04, the NDX had retraced almost 90% of its entire decline from 7/19 to 8/16, easily outpacing all other indices. Since the NDX has proven historically to be an excellent precursor of intermediate trends, this is a bullish sign.
What's Ahead?
Momentum:
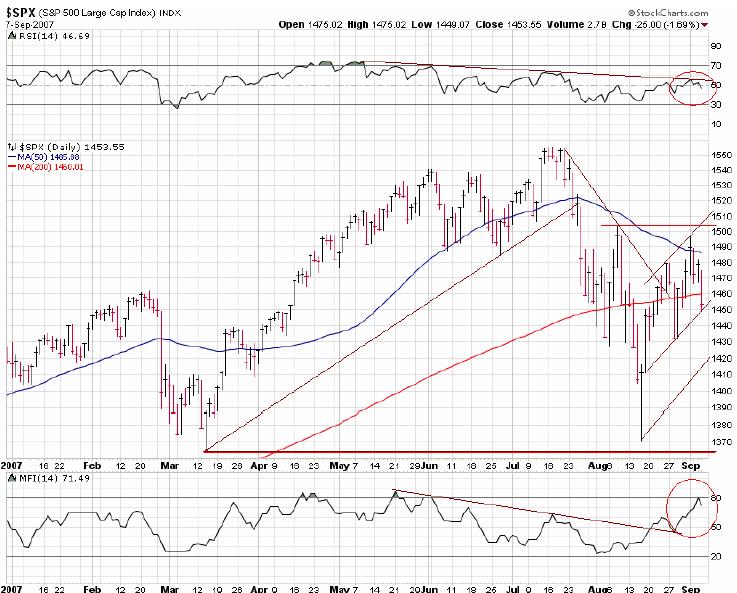
Here are a few things to note on the following chart of the daily SPX (courtesy of StockCharts).
Positives:
- A climactic low (which held above its last intermediate-term low) was followed by a strong rally and a pattern of higher highs and higher lows.
- The 200 DMA is still rising and the 50 DMA is beginning to flatten.
- The Money Flow Index is strong.
Neutral/negatives:
- The RSI has not yet broken out of its downtrend line.
- The index has not yet surpassed its former 1503 high.
Taking all this into consideration, the index is in a short-term uptrend of higher highs and higher lows, but needs to overcome the 1503 level before it is in a confirmed intermediate-term uptrend. And, of course, it will have to rise beyond 1555 to continue its long-term trend. With the 4.5-yr cycle ostensibly having bottomed on 8/16, it's probably only a matter of time before both of the longer-term trends are resumed.
In retrospect, the recent price action is probably going to be a consolidation in a long-term uptrend.
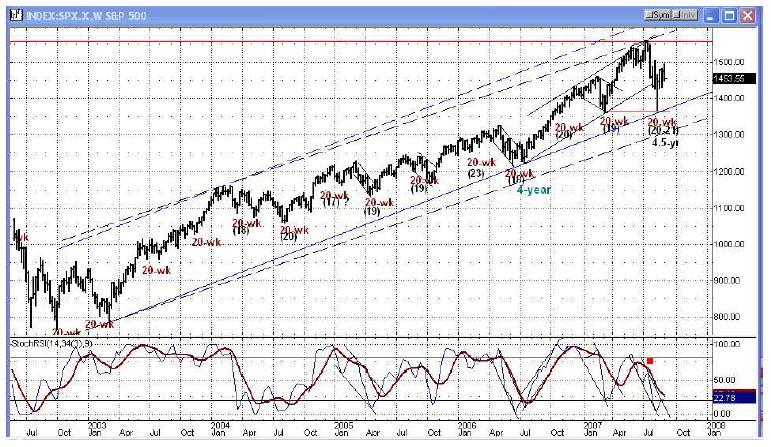
I have expanded the weekly chart to include the entire bull market move from 2002. Notice that I have drawn 2 channels which represent the uptrend. The black dashed line connects the tops and a parallel is drawn across the lows. The second is formed by connecting the 2003 and 2006 lows with a (blue) trend line, and placing a dashed parallel line at the 2004 top.
Whichever channel you choose, you'll have to admit that the SPX is still in a long-term uptrend. Notice also that the recent decline found support near the blue uptrend line.
In the momentum indicator at the bottom of the chart, the thin line has now broken outside of its down channel, but is still below the heavy line. This is an improvement, but not yet a confirmation. that the trend momentum has shifted to the upside.
Cycles
I am going to continue to assume that the 4.5-yr cycle made its low on 8/16 and has now turned up.
Until recently, I was not entirely sure if the 20-wk cycle had bottomed on 8/6 or 8/16 and was waiting to see which of the two dates would be confirmed by the market action. It's beginning to look as if the former will be the correct one. There is a dip where the 2.5-wk should have been, and the current decline looks like it was caused by the 5-wk, which may have bottomed on Friday, or will do so Monday. Any serious weakness on Monday would be an indication that larger cycles are in control.
A good argument that the bull market is intact is made by the 4.5-yr and the 20-wk cycles which both exhibited extreme right translation at their recent peaks before they made their lows, a sign that longer-term cycles are still pushing up.
Looking ahead, the market will have to contend with two cyclic factors. The first is that there is a nest of short-term cycles occurring in the 3rd week of this month, and the second is that the 12-mo cycle due about October is in the process of making its low, which is probably the main reason why the short-term cycles are having such an impact on prices. This would tend to signal that additional consolidation for the market lies directly ahead. However, we cannot discount the impact of economic factors. If the Federal Reserve lowers interest rates on 9/18 or before, it will undoubtedly create a rally which could enhance the upward pressure of the cycles which have already bottomed. After the 12-mo cycle has turned up, all cycles should be in synch to push the market up to new highs.
Looking farther out, the 2-yr and 6-yr cycles are expected to exert downward pressure by the end of the year.
Projections
In my last Week-end Report to subscribers, I made the following statement:
The bottoming action and reversal formed a Point and Figure base which has two valid counts of 1485 or 1497. There is also a Fibonacci target zone of 1480-1498. Both of these projections, achieved by two different methodologies which closely confirm each other, may end the initial rally of the SPX from 1372 and lead to some additional base building and perhaps a test of the lows.
The SPX did in fact rise to 1496.40 before turning down. Since then, it has been correcting and reached a low of 1449.07 on Friday. This satisfied short-term Fibonacci and Point & Figure projections for the decline.
The overall action of the market gave some indication that the low could have been made on Friday, but for a reversal to be confirmed, the index would have to rise above 1465. No projection to the upside can be made until we have a trend reversal but, should this occur, it is conceivable that a rally could develop which will challenge the recent high.
Breadth
The Summation Index is rising from a very oversold condition, but is still in negative territory.
The McClellan indicator made a double-top in an overbought position before correcting once again to the zero line. It is currently neutral.
On Friday, hourly A/D figures were very negative but, in the last 3 hours of trading, they showed that selling pressure was abating -- a condition which normally signals that a cycle is bottoming and that a trend reversal is about to take place.
Market Leaders & Sentiment
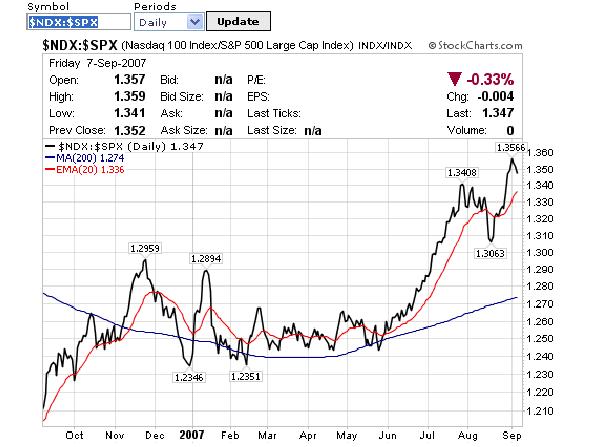
Below is a chart of the NDX/SPX relationship. As you can see, since the ratio has exceeded its August high by a wide margin, it strongly favors the NDX. This would seem to confirm other evidence that suggests that the bull market is still intact.
The short-term ISEE option index is currently neutral/negative. However, according to Thompson
Financial, insider buying in August rose to its highest monthly volume level since 1990. This is of
long-term bullish significance.
Summary
The original base count from the low was met last Friday at 1496.40, and this -- with the assistance of a short-term cycle -- brought about a reversal. The SPX may now want to expand its base by forming a consolidation pattern which will expand the upward projection and could take at least to the end of September to complete. The 12-mo cycle normally makes a low around this time of the year, and it will have to go through its bottoming process before the market can resume its uptrend.
A market advisory service should be evaluated on the basis of its forecasting accuracy and cost. This service is probably the best all-around value. Two areas of analysis that are unmatched anywhere else -- cycles and coordinated Point & Figure and Fibonacci projections -- are combined with other methodologies to bring you weekly reports and frequent daily updates.
The following are examples of unsolicited subscriber comments:
What is most impressive about your service is that you provide constant communication with your subscribers. I would highly recommend your service to traders. D.A.
Andre, You did it again! Like reading the book before watching the movie! B.F.
I would like to thank you so much for all your updates / newsletters. as i am mostly a short-term trader, your work has been so helpful to me as i know exactly when to get in and out of positions. i am so glad i decided to subscribe to turning points. that was one of the best things i did ! please rest assured i shall continue being with turning points for a long while to come. thanks once again ! D.P.
But don't take their word for it! Find out for yourself with a FREE 4-week trial. Send an email to ajg@cybertrails.com .
By Andre Gratian
MarketTurningPoints.com
A market advisory service should be evaluated on the basis of its forecasting accuracy and cost. At $25.00 per month, this service is probably the best all-around value. Two areas of analysis that are unmatched anywhere else -- cycles (from 2.5-wk to 18-years and longer) and accurate, coordinated Point & Figure and Fibonacci projections -- are combined with other methodologies to bring you weekly reports and frequent daily updates.
“By the Law of Periodical Repetition, everything which has happened once must happen again, and again, and again -- and not capriciously, but at regular periods, and each thing in its own period, not another’s, and each obeying its own law … The same Nature which delights in periodical repetition in the sky is the Nature which orders the affairs of the earth. Let us not underrate the value of that hint.” -- Mark Twain
You may also want to visit the Market Turning Points website to familiarize yourself with my philosophy and strategy.www.marketurningpoints.com
Disclaimer - The above comments about the financial markets are based purely on what I consider to be sound technical analysis principles uncompromised by fundamental considerations. They represent my own opinion and are not meant to be construed as trading or investment advice, but are offered as an analytical point of view which might be of interest to those who follow stock market cycles and technical analysis.
Andre Gratian Archive |
© 2005-2022 http://www.MarketOracle.co.uk - The Market Oracle is a FREE Daily Financial Markets Analysis & Forecasting online publication.