


The Dynamic Web and the Fibonacci S&P Golden Ratio Support at 1013.14
Stock-Markets / Stock Markets 2010 Jul 15, 2010 - 09:19 AM GMT

 Those who followed the research of the late great market forecaster PQ Wall will recall his concept of the Dynamic Web for market price analysis. My Fibonacci price grid research builds on PQ’s Dynamic Web research. A brief review of PQ’s approach helps explain how Fibonacci price grids bring additional clarity and powerful investing and trading tools to the Dynamic Web approach.
PQ Wall did not use Fibonacci ratios in his Dynamic Web research. He used equidistant thirds or 33% of an existing or expected move to generate his price forecasts. PQ also used zero as his base number for the start of his top-level price grid and then an actual or projected price for the high. He then used this range to produce mini-ranges. This approach roughly approximates the Fibonacci price grid approach, which is why PQ often called major price turns with consistent accuracy.
In our work, we use the important 1982 intraday market low as the base number and the 2007 intraday high for the Level 1 Fibonacci grid that is the primary driver of the current global market price action. Through years of extensive testing, I discovered that the Fibonacci ranges and important intraday lows generated the most accurate price targets. Mr. Market was clearly uses them in daily decision-making. Mr. Market being the name I use for the sum of collective human action in markets, and thus cycles.
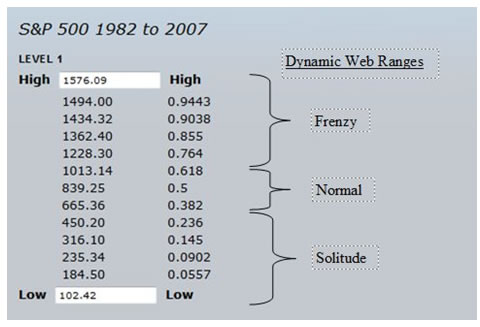
PQ used the following labels from lowest to highest for three price ranges; 1) Solitude Range 0-33%, 2) Normal Range 33-66%, and 3) Frenzy Range 66-100%. These three ranges also apply to the Fibonacci price grid approach, but instead of using 33% of the price move in a given range, or expected move, the following ranges are used in our Fibonacci Dynamic Web work; 1) Solitude Range 0-38.2%, Normal Range 38.2-61.8%, and 3) Frenzy Range of 61.8-100%.
The Fibonacci Dynamic Web ratio range model is similar in philosophy to PQs approach, but provides far more accurate forecasting for major and minor market support and resistance levels. The increase in accuracy for forecasting price movements in the smaller and larger cycles using the Fibonacci price grid method is dramatic. The Normal range is in between the inverse golden and golden ratios for any given Fibonacci level, and represents the level Mr. Market often struggles to attain.
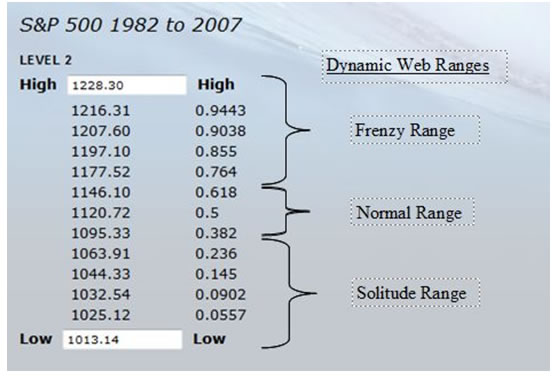
The range brackets in the Level 1 price grids illustrate PQ’s Dynamic Web Range method applied to the Fibonacci price grids. For subscribers we provide the price grids at Level 2, e.g, 1013.14-1228.30 (see below), which is the Fibonacci grid where the Mr. Market is currently pitching his tent. We also provide Level 3 Fibonacci Dynamic Web grids. Mr. Market consistently turns exactly on or within a few 100ths of a point of the Fibonacci price targets on the Level 2 and Level 3 grids.
On April 28, 2010, a mere two days after Mr. Market’s top tick intraday high for the year at 1219.80 on April 26, 2010, and in the final Level 3 grid before 1228.30, we published and article and argued that the 1228.30 Level 1 Fibonacci target was fading fast. In fact, we identified top tick at 1219.80 at the exact inverse golden ratio price in the Level 4 Fibonacci price grid, drilling down four levels in the Fibonacci price grid. In that article we even quoted Shakespeare’s admonition at such intersections in life, “On such a full sea are we now afloat, and we must take the current when it serves, or lose our ventures.” That top tick still looks like a solid candidate to hold for the entire post 2009 bear market rally.
Note that the number of Fibonacci targets provided in the Solitude and Frenzy ranges make them look larger than they are relative to the Normal range. The Normal range is 23.6% of the entire price range for any given Fibonacci level, with the Solitude and Frenzy range being 38.2% each of the entire range.
As the market tries to break out or fall from one range into the next range, it hands excellent opportunities to traders. These three ranges reflect Mr. Market’s mood at every drilldown Fibonacci grid Level. In the coming months we expect the market to break down through the critical support at 1013.14, which will represent the Level 1 drop below the golden ratio of 61.8%, and from the Frenzy range to the Normal range in our Fibonacci approach to the Dynamic Web. When this occurs, and the market closes below this golden ratio, the next “unpredictable” black swan event may take place in global markets.
On the selloff into July 1, 2010 Mr. Market dipped his toe just under the 1013.14 target to 1010.91 to test the waters in the Normal Range of the entire 1982-2007 edifice. It sent a shiver up his spine. The tower of Babel built on debt appears to be getting a bit wobbly. The drop beneath the golden ratio scared Mr. Market and he rushed back up into the Level 2 range above 1013.14, and has thus far has climbed to the inverse golden 38.2% target at 1095.33 and is attempting to move back into the Normal range of the Level 2 grid above this level. Mr. Market closed at 1095.34 on July 13, 2010 and 1095.14 on the July 14, just to make the point.
What we propose is that Mr. Market is in danger of falling through the solitude range in Level 2 and collapsing through the golden ratio floor of Level 1. For two days Mr. Market has closed within a few 100th of a point of the Normal Range Level 2 target of 1095.33. I now fear he hangs by the thread of rapidly waning global sentiment.
Before the global bear market is over in 2012, our anticipation is that the S&P will drop into the Solitude range below 665.36. The 61.8% golden ratio in the Level 1 Solitude range is 450 on the S&P, making it a prime target in this bear market.
Once the market clearly breaks into a new range, it will tend to trade in that range for an extended period, depending upon the scale of the Fibonacci price grid, which brings time into the equation in addition to price. To forecast cycle time in addition to price, Fibonacci cycles in time are applied just as effectively as Fibonacci price grids. This is how LongWaveDynamics.com uses the various cycles in time; including the Kondratieff long wave, long wave season, Kitchin cycle, Kitchin Third, Wall cycle and Quarter Wall cycle.
If readers want a better understanding of our advanced cycle research in time and price, order a copy of our new book Jubilee on Wall Street; An Optimistic Look at the Global Financial Crash, available in from Amazon.com. It will give you a new and refreshing perspective on technical analysis and the debt and financial global crisis, which is now entering its second leg into 2012. The Long Wave Dynamics Letter will keep you current on the Fibonacci Dynamic Web at all levels, and all the key cycles in time.
In the way of review, in a May 14, 2010 article I identified, June 18, 2010, as an important date of interest, due to the fact is was an exact Fibonacci extension in time for the entire long wave from the exact 1949 start date. Although we recognized in that article that these dates sometimes produce highs, at the time, it looked more probable as a Wall cycle low. The Wall cycle abruptly bottomed early, and Mr. Market then rallied hard and marked the June 18, 2010 date as the closing high of the S&P 500 thus far in the new Wall cycle (aka 20-week cycle). Mr. Market loves irony. That top tick date may well stand as the Wall cycle high. The current market action appears to be suggesting a hard down Wall cycle that will take out the Golden ratio target, triggering a more significant price decline. Consider yourself warned.
Changing the subject a bit, lest you conclude that I am just another gloom and doom perma-bear, just a few words on Intel’s great earnings report are in order. You might ask how a major U.S. company can be setting revenue, gross margin and earnings records as the world sails into a long wave winter season of debt deflation. Intel is a primary beneficiary of the rush to efficiency that a long wave winter season demands of the business world. The fact that emerging markets have one foot in the new long wave advance, and are seeking to extricate themselves from developed world deflation and stimulate domestic growth, is also greatly benefiting Intel.
Also, and possibly most important, is a force not yet recognized by most observers. Corporations large and small around the world are rushing to embrace and deploy loosely distributed object model information system platforms. The objective of this move is the pursuit of efficiency. The persistent drive for efficiency will drive the next long wave advance. The object model paradigm and its computer code will be running under the hood of businesses, governments and educational institutions large and small when the next long wave spring season rolls around in 2012. However, there is something you need to know about the object model paradigm, is abhors centralization of power and undermines it. It forces power down to the most appropriate level and empowers the individual. Existing political, economic and media structures are going to be blown to bits in the global debt and financial crisis we are sailing into between now and 2012. The object model begin to take the wheel of global information systems and trigger a global boom greater than any in human history.
When Oswald Spengler wrote Decline of the West, and recognized that the specialization of labor collapsed past civilizations, he did not anticipate the Internet and the power of the object model paradigm. There are very specific reasons that I am optimistic about the changes that will be produced by this long wave winter season and modern day global debt bust Jubilee.
I plan to write more on this trend in the future, but for now you need to know that global information systems adopting the object model paradigm virtually guarantee that The Great Republic, a new age in international free market capitalism, will emerge from the global crisis. The Great Republic changes everything, forever. Be prepared, or be swept away.
David Knox Barker is a long wave analyst, technical market analyst, world-systems analyst and author of Jubilee on Wall Street; An Optimistic Look at the Global Financial Crash, Updated and Expanded Edition (2009). He is the founder of LongWaveDynamics.com, and the publisher and editor of The Long Wave Dynamics Letter and the LWD Weekly Update Blog. Barker has studied and researched the Kondratieff long wave “Jubilee” cycle for over 25 years. He is one of the world’s foremost experts on the economic long wave. Barker was also founder and CEO for ten years from 1997 to 2007 of a successful life sciences research and marketing services company, serving a majority of the top 20 global life science companies. Barker holds a bachelor’s degree in finance and a master’s degree in political science. He enjoys reading, running and discussing big ideas with family and friends.
© 2010 Copyright David Knox Barker - All Rights Reserved Disclaimer: The above is a matter of opinion provided for general information purposes only and is not intended as investment advice. Information and analysis above are derived from sources and utilising methods believed to be reliable, but we cannot accept responsibility for any losses you may incur as a result of this analysis. Individuals should consult with their personal financial advisors.
© 2005-2022 http://www.MarketOracle.co.uk - The Market Oracle is a FREE Daily Financial Markets Analysis & Forecasting online publication.