


Stock Market Dumb Money Turns Bearish Which is Bullish
Stock-Markets / Stock Market Sentiment Aug 29, 2010 - 02:18 PM GMTBy: Guy_Lerner

 As expected, the "dumb money" has turned bearish on the markets, and this is a bullish signal.
The "Dumb Money" indicator (see figure 1) looks for extremes in the data from 4 different groups of investors who historically have been wrong on the market: 1)Investors Intelligence; 2) Market Vane; 3) American Association of Individual Investors; and 4) the put call ratio. The "Dumb Money" indicator has turned bearish and this is a bullish signal.
Figure 1. "Dumb Money"/ weekly
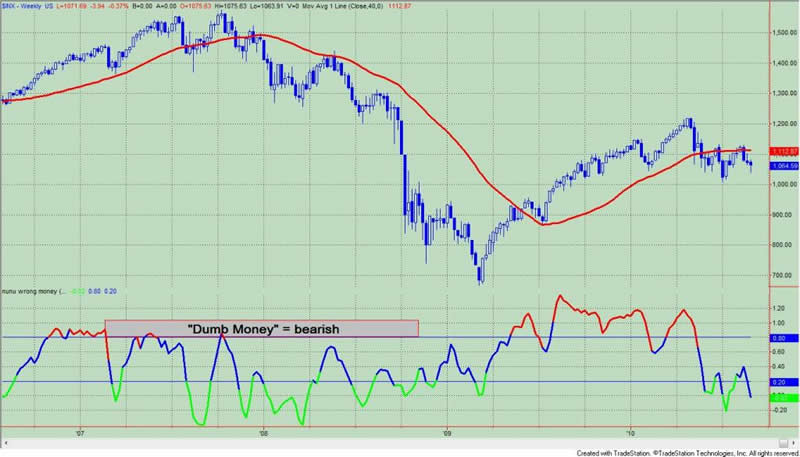
For a broader look at the significance of a bullish signal from the "Dumb Money" indicator, please check out the following article from March, 2009: "Putting a Bullish Signal Context". In general, when sentiment is bearish, gains in the stock market occur at an accelerated rate. In essence, betting against the consensus can yield significant gains with minimal market exposure. However, there is no "holy grail", and risks remain as failed signals can lead to spectacular losses.
The two most recent signals occurred on May 28, 2010 and July 2, 2010. During the time, the "Dumb Money" indicator had a bullish signal the S&P500 gained 4.94% and 2.19% over a 2 and 3 week periods, respectively. Once again this is consistent with our notion of accelerated, annualized gains when sentiment is bearish.
However, what has been missing from these signals is a lack of follow through. The gains in the major indices have been unsustainable, and after 3 months and 2 prior signals, we find the market right back where we started. Not much progress has been made. This should be of concern for the bulls.
So with investors currently bearish, I suspect the short term will be capped to the downside. A weekly close below 105.44 on the SPY likely means a bear market. Failed signals in the face of bearish investor sentiment are a sign of a bear market. A weekly close above 107.58 would be bullish. With price currently at 106.86 on the SPY, this puts the SPY in a very narrow range that will be resolved soon.
The "Smart Money" indicator is shown in figure 2. This is calculated utilizing data about SP100 options, which is thought to represent large traders. Previously, the "smart money" calculations utilized data from the NYSE; this data is no longer publicly available.
Figure 2. "Smart Money"/ weekly
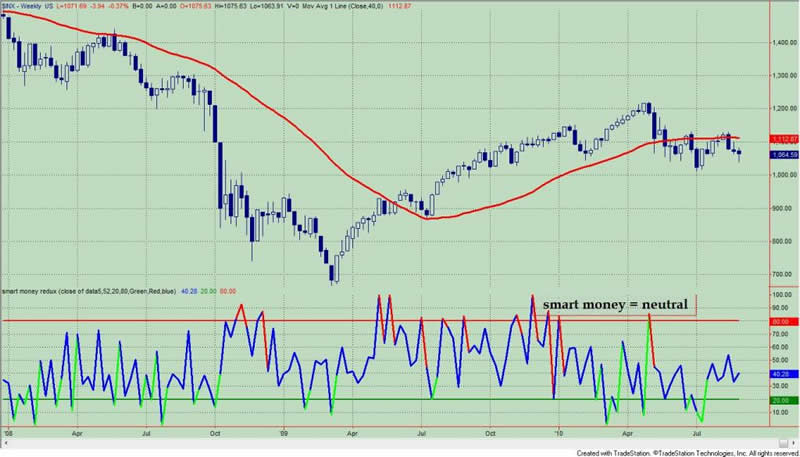
Figure 3 is a weekly chart of the S&P500 with the InsiderScore "entire market” value in the lower panel. From the InsiderScore weekly report: "In many respects last week was very similar to the previous week. Buyers outnumbered sellers by a wide margin, but to a much smaller degree when the Financial sector is removed from the equation. The difference between the two weeks was in the conviction shown by buyers - there was less of it during the most recent period."
Figure 3. InsiderScore "Entire Market" Value/ weekly
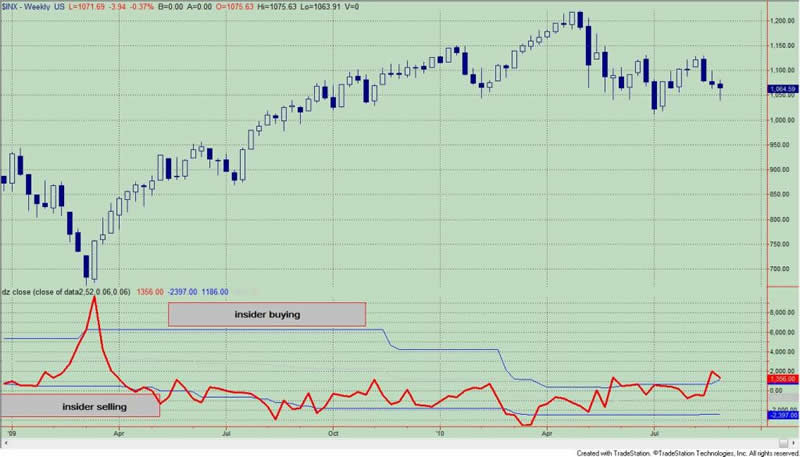
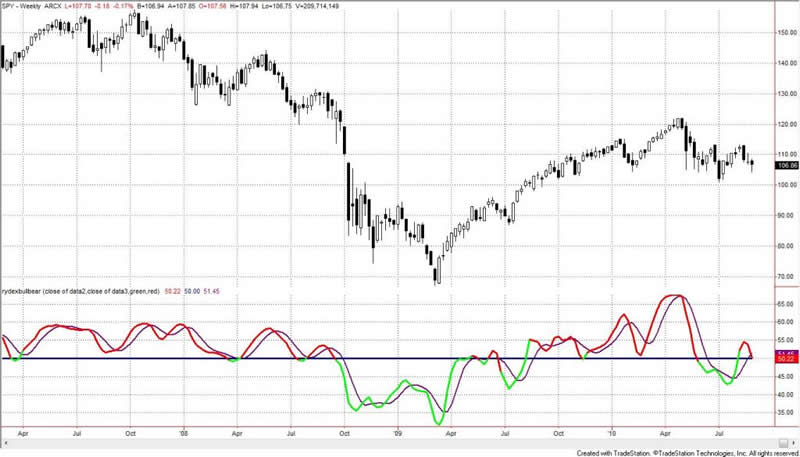
Figure 4 is a weekly chart of the S&P500. The indicator in the lower panel measures all the assets in the Rydex bullish oriented equity funds divided by the sum of assets in the bullish oriented equity funds plus the assets in the bearish oriented equity funds. When the indicator is green, the value is low and there is fear in the market; this is where market bottoms are forged. When the indicator is red, there is complacency in the market. There are too many bulls and this is when market advances stall.
Currently, the value of the indicator is 50.22%. Values less than 50% are associated with market bottoms.
Figure 4. Rydex Total Bull v. Total Bear/ weekly
Improve your market timing withPremium Content from TheTechnicalTake.
The Premium Content service is the best $104 you will ever spend on market research. The daily report is meant to keep you on the right side of the market and improve your market timing. That's 40 cents a day!
We know the Premium Content service has been useful because we can track the number of subscribers who download and read the reports everyday. Over 90% of the subscribers access this research everyday!
To subscribe to Premium Content click here: Subscribe
By Guy Lerner
http://thetechnicaltakedotcom.blogspot.com/
Guy M. Lerner, MD is the founder of ARL Advisers, LLC and managing partner of ARL Investment Partners, L.P. Dr. Lerner utilizes a research driven approach to determine those factors which lead to sustainable moves in the markets. He has developed many proprietary tools and trading models in his quest to outperform. Over the past four years, Lerner has shared his innovative approach with the readers of RealMoney.com and TheStreet.com as a featured columnist. He has been a regular guest on the Money Man Radio Show, DEX-TV, routinely published in the some of the most widely-read financial publications and has been a marquee speaker at financial seminars around the world.
© 2010 Copyright Guy Lerner - All Rights Reserved
Disclaimer: The above is a matter of opinion provided for general information purposes only and is not intended as investment advice. Information and analysis above are derived from sources and utilising methods believed to be reliable, but we cannot accept responsibility for any losses you may incur as a result of this analysis. Individuals should consult with their personal financial advisors.
Guy Lerner Archive |
© 2005-2022 http://www.MarketOracle.co.uk - The Market Oracle is a FREE Daily Financial Markets Analysis & Forecasting online publication.