


The Elasticity of Taxable Income - How the Laffer Curve Really Works
InvestorEducation / Taxes Sep 24, 2007 - 08:23 AM GMTBy: Gerard_Jackson

Let us begin with the much neglected Kennedy tax cuts and then follow through with other tax measures. We shall then finish with a diagrammatic explanation of how cuts in capital gains taxes expand both the economy and tax revenues.
Kennedy declared that “it is a paradoxical that tax rates are too high and tax revenues too low”. In other words, high taxes were depressing output. Acting on this belief — what so many today sneeringly call supply-side economics — he cut taxes in 1963 and investment surged ahead. In the four years preceding the Kennedy cuts only 27.8 per cent of what is termed investment went to business and 38.5 per cent to real estate.
During the four years following the cuts 58.6 per cent went into business and a mere 11.2 per cent went into real estate. But who gave Kennedy this economic advice, apart from Ludwig Erhardt, West Germany's minister of finance, there was the Keynesian Walter Heller for one who believed tax cuts could increase tax receipts. As he himself said:
The upsurge of tax revenues flowing from economic expansion would finance higher levels of local, state, and Federal spending than we would have had without the tax cut's stimulus…(Cited in A. James Meigs' Money Matters: Economics, Markets, Politics , Harper & Row, Publishers, 1972, p. 38).
The economic response to the Kennedy tax cuts demonstrated that you cannot have a dynamic economy if venture capital is penalised, entrepreneurial mobility severely restricted and the rewards of successfully satisfying consumers' needs are heavily taxed. In 1969, for example, President Nixon raised the capital gains tax from 28 per cent to 49 per cent. Result: revenue from the tax dropped sharply with realised gains from the sale of capital assets falling by 34 per cent, and the stock issues of struggling companies falling from about 500 in 1969 to precisely four in 1975. High-tech companies in Silicon Valley were hit particularly hard. Yet the Treasury had assured President Nixon that the tax increase would raise $1.1 billion in the first year and then $3.2 billion a year until 1975. This is obvious proof that taxes do affect behaviour. If you think about it, capital gains taxes are a great way to soak the poor.
In 1978 Congress for once did the sensible thing and slashed capital gains taxes: this resulted in the supply of venture capital exploding. By the start of 1979 a massive commitment to venture capital funds had taken place, rising from a pathetic $39 million in 1977 to a staggering $570 million at the end of 1978. Tax collections on long-term capital gains, despite the dire predictions of Keynesian big-spending critics of tax cuts, leapt from $8.5 billion in 1978 to $10.6 billion in 1979, $16.5 billion in 1983 and $23.7 billion in 1985.
By 1981 venture capital outlays had soared to $1.4 billion and the total amount of venture capital had risen to $5.8 billion. In 1981 the maximum tax rate on long-term capital gains was cut to 20 per cent. This resulted in the venture capital pool surging to $11.5 billion. Astonishingly enough — to conventional economists that is — venture capital outlays rose to $1.8 billion in the midst of the 1982 depression. This was about 400 per cent more than had been out-laid during the 1970s slump. In 1983 these outlays rose to nearly $3 billion. Compare this situation to the period from 1969 to the 1970s which saw venture capital outlays collapse by about 90 per cent. All because of Nixon's ill-considered capital gains tax. But then Nixon — unlike so many journalists — never professed to know anything about economics.
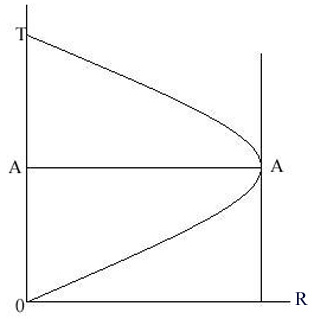
In 1982 the US General Accounting Office sampled 72 companies that had been launched with venture capital since the 1978 capital gains tax cut. The results were startling. Starting with $209 million dollars in funds, these companies had paid $350 million in federal taxes, generated $900 million in export income and directly created 135,000 jobs! The figure below illustrates the Laffer curve. The vertical axis is the tax rate and the horizontal axis is tax revenue while point A is the optimum tax. When the tax rate exceeds point A tax revenues fall. It follows, therefore, that any movement back to point A will increase revenues.
The actual basis of the Laffer curve is the knowledge that if you want more of something then reduce the cost of producing it. In this case it is not really tax revenues that we want to increase but investment. Investment is fuelled by savings . Hence capital gains taxes strike at savings and investment which in turn keep living standards lower than they would otherwise be. From this we can deduce that capital gains taxes are also transaction taxes. Where they are levied on the sale of assets, e.g., shares, they have the effect of reducing the number of transactions because this is an easy way of avoiding the tax.
Try to imagine for a moment what would have happened to economic growth in nineteenth century England if, for example, investors had been punitively taxed for trying to move their investments from canal companies to railway and coal companies. This brings us to figure 1 which is a country's production structure. Each rectangle is a stage of production and the steps between the stages represent the price margins for each stage 1 .
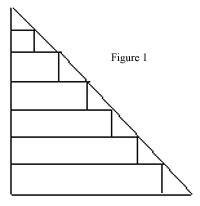
This approach stresses two important facts: a) production happens through time and b) occurs in stages. Now it is important to stress these two facts because the majority of economists adhere to the Clark-Knight treatment of capital that views it as a permanent and self-maintaining fund. They also assume that production and consumption occur simultaneously instead of occurring through time. (John Bates Clark Essentials of Economic Theory , The Macmillan Company, 1924, pp. 18-19 and p. 29).
It will be noted that figure 1 has 7 stages. Let us assume that the government abolishes capital gains taxes. The first effect will be to widen the price margins. The differences between the new price margins and the old ones are capital gains. Now capital gains are profits. When these emerge it is an indication that factors of production are undervalued in relation to the value of their products. This means that it now profitable for capitalists to employ more and more factors of production until the capital gains have been competed away.
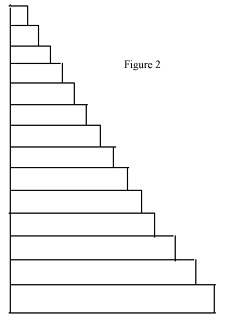
The result is a longer and wider capital structure as represented by figure 2. We can now see that the new capital structure is far more productive than the old one. Gross savings — which by definition includes spending on intermediate goods — has also increased. So long as this business spending is maintained the capital structure will not shorten. It should be plain enough that in a free market the amount of gross savings depends on decisions made by capitalists. There is nothing permanent or automatic about the capital structure or entrepreneurial decision-making. (Friedrich von Hayek Prices and Production , Augustus M. Kelley, 1967 and The Pure Theory of Capital , The University of Chicago Press, 1975).
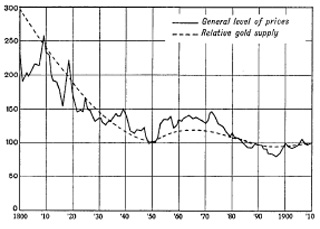 |
| Taken from Michael A. Heilperin's International Monetary Economics , Longmans, Green and Co. 1939, p. 35. |
The lengthening and widening of the capital structure is what happened in nineteenth century Britain. For example, We can see from the chart above that general prices peaked in 1872 and then began a long decline, falling from 150 to about 70, a drop of some 53 per cent. Whichever way one looks at it this was a remarkable achievement. It was period that saw a steady increase in both money wages and real wages even as the population increased significantly. Of particular interest is government spending which in 1841 was 11 per cent of GDP but only 9 per cent in 1890. (H. S. Ferns The Disease of Government , Maurice Temple Smith, 1978, p.16). However, a halving of prices doubles purchasing power, so in real terms government spending rose significantly during that period.
Nevertheless, none of the above directly tells us how the Laffer curve generates so much revenue. This brings us to the dangerous fallacy of the stable price level, according to which a stable price level indicates the absence of inflation 2 . For the price level to remain stable it is argued that monetary expansion must equal the growth in output 3 . In plain English, monetary policy must be manipulated in away that offsets the beneficial effects of increased productivity.
Therefore, as the cut in capital gains taxes stimulates investment and production monetary policy increases the money value of the increased output. As expenditure increases so does the increase in tax revenues. It should be obvious that this is an argument against monetary manipulation and not cuts in capital gains taxes. Furthermore, the British experience clearly demonstrates that even in the absence of an ‘accommodating' monetary policy the government would still eventually raise its spending in real terms which would compensate for any reduction in revenue due to cutting capital gains taxes.
Note: I need to emphasise a couple of points here. Firstly, the complexity of the production structure is far too great for anyone to comprehend. Even in the case of a single product there could be hundreds if not thousands of stages of production as the following quote from Hayek explains:
What is no less important is that, in the course of the lengthening of the process, the stream of operations leading up to a given product will as a rule be split up into many branches and sub-branches. And it may be that, long before the first move is made to produce the actual material from which the product is to be made, work is being taken in hand to provide some auxiliary material or tool which will be needed later to convert the raw material into the final product. At each stage of the process from the raw material to the finished product the main stream will be joined by tributaries which in some cases may already have run through a much longer course than the main stream itself. But all these activities, many of which may be carried on at the same time at different places, have to be regarded as part of the same process, and have to be taken into account when we talk about its length. The series of operations which are required in order to provide the fuel or lubricant, and the tools or machines which are needed for turning the raw material into the finished product, are just as much part of the process of production of the good as the operations performed on the raw material. ( The Pure Theory of Capital , The University of Chicago Press, 1975, pp. 174-175)
Secondly, for reasons of exposition I ignored the role monetary policy can play in shaping the capital structure. Hayek did, however, deal with this problem in tabulated form in The “Paradox” of Saving in Profits, Interest and Investment , Augustus M Kelley Publishers, 1975.
1. This analysis was pioneered by William Stanley Jevons ( Theory of Political Economy , 4th edition Augustus M Kelley & Millman, Inc. 1957, pp. 229-235) . Knut Wicksell also used a structure of production approach with a time dimension ( Lectures on Political Economy , Augustus M. Kelley Publishers 1977, pp. 151-153).
2. Greenspan's price rule caused the US recession — and it's going to happen again explains why the price rule destabilises economies.
3. Only a very few economists know that in the nineteenth Britain was on a quasi-gold standard. The amount of notes and bank credit always greatly exceeded gold reserves.
Gerard Jackson
BrookesNews.Com
Gerard Jackson is Brookes' economics editor.
Gerard Jackson Archive |
© 2005-2022 http://www.MarketOracle.co.uk - The Market Oracle is a FREE Daily Financial Markets Analysis & Forecasting online publication.