


Stock Market Crash, Bull or Bear?
Stock-Markets / Stock Markets 2010 Sep 02, 2010 - 03:33 AM GMTBy: JD_Rosendahl

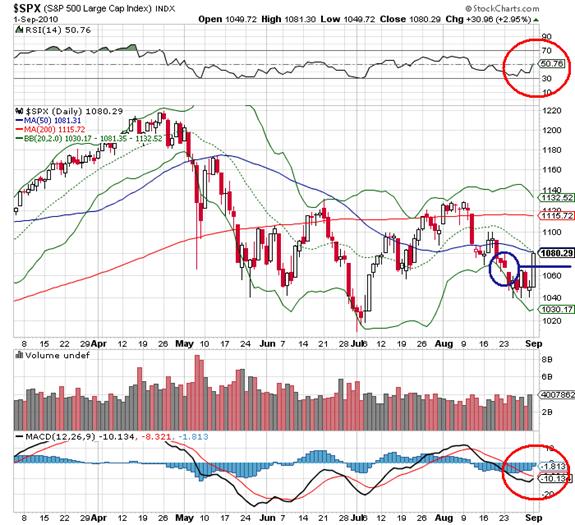
 Today’s rise in the stock market seems to have put in a near term bottom by advancing over the recent gap in price @ 1,071 on the SP500. Today, we had a strong move covering the gap resistance and the market closed right at its high and the 50 day MA. Above the 50 day MA is the next hurdle. MACD and RSI are turning up to support price.
And as always, Mr. Market provides everyone something to cling to in the near future.
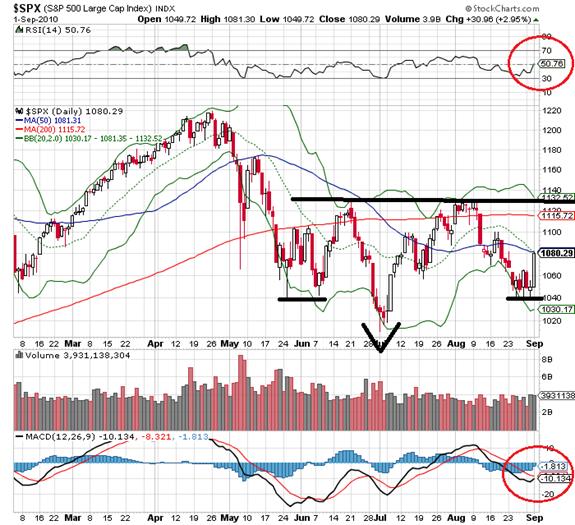
The Bullish View: The bull view is an inverse head and shoulders pattern. The pattern’s target price upon breaking above the neckline is 1,250ish.
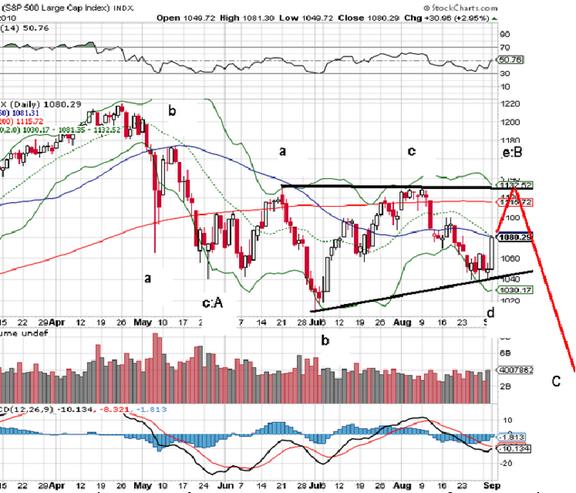
The Bear View: The bears will see a wedge pattern in development. I’ve drawn in the Elliott Wave count to reflect what the wedge pattern looks like. It requires a move higher to finish wave B before a declining wave C with a target of roughly 950 on the SP500, see chart below:
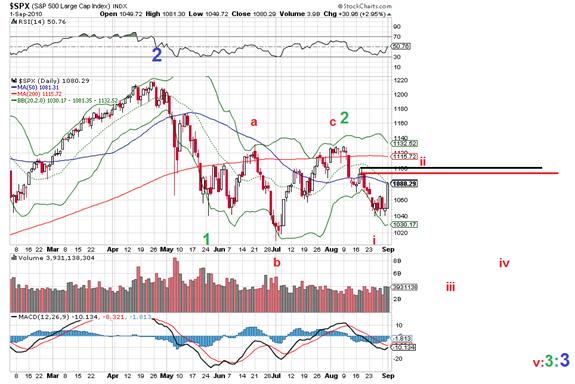
The Crash: I've done my best to provide the Elliott Wave structure the ardent bears have for the massive wave 3 down. It's more of a visual, but I want to focus on where we are now in this view We just finished wave i and in wave ii. If so, wave ii should stall at the 62% retracement level, or the price resistance at 1,100.
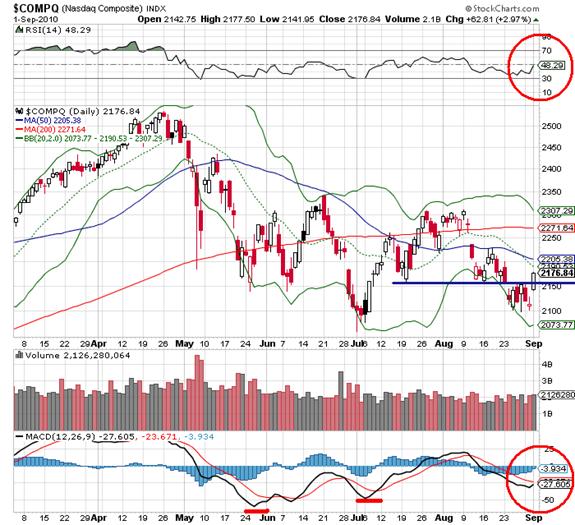
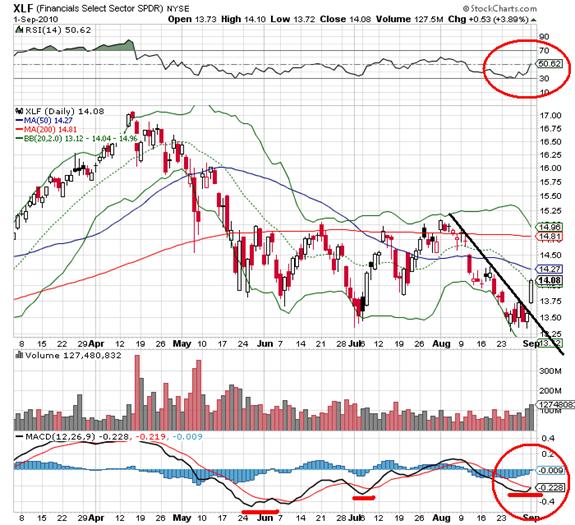
$COMPQ and XLF: This is where the action was really interesting today. For the markets to go higher, risk and money need to be part of the move. The $COMPQ slightly underperformed the market, but the financials where well ahead of the market's performance on a percentage basis. $COMPQ climbed above gap resistance while the XLF gapped over it's down trend line. In both cases, we have the MACD and RSI turning up to support price with divergences forming on the MACD. If it's the bullish market view, these need to be strong contributors.
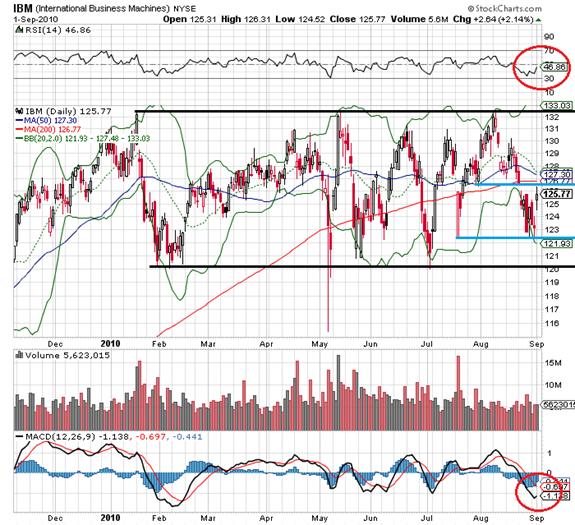
IBM: Big move higher, but still below the 50 and 200 day MAs. If it gets above that, IBM could easily retest major price resistance, which would be the 4th attempt! Above that could easily support the bullish view on the stock market.
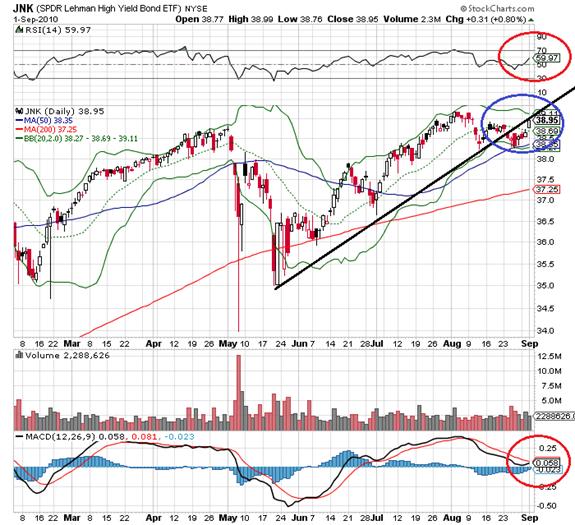
JNK: It finally moved and has retested the uptrend line. A move above that is a bullish indicator for the stock market. If the market is moving higher, than those putting money back into riskier assets should also be comfortable with junk bonds. This is why I feel JNK is a decent indicator for the market's health.
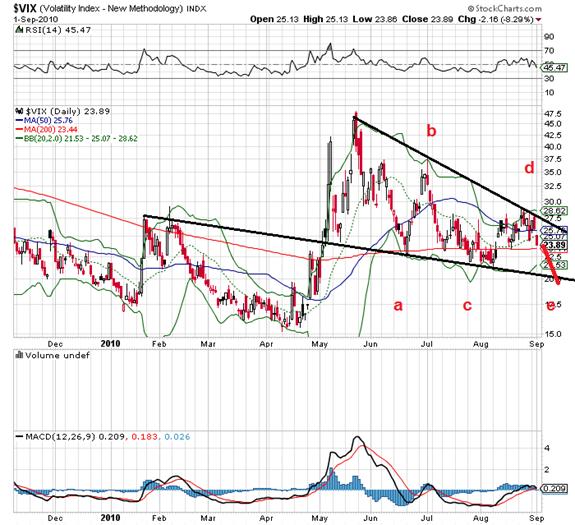
$VIX: The index seems to have rolled over, which would indicate another test of the bottom support line is now the expected move.
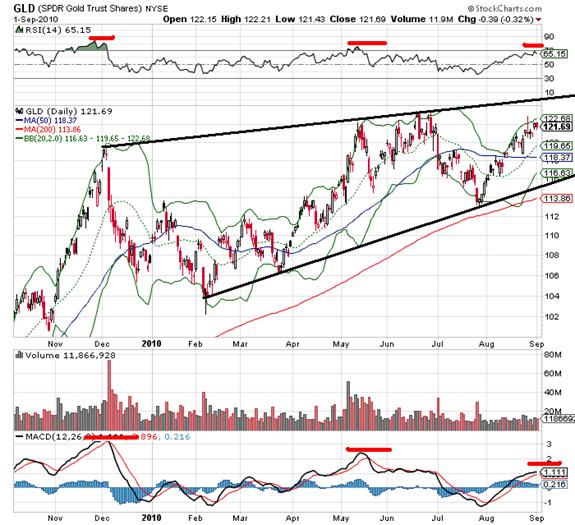
GLD: The gold market is starting to look tired. If the stock markets are going higher, we should expect the safe haven trades to consolidate at a minimum. And that seems to be what the bearish divergences on the RSI and MACD are suggesting.
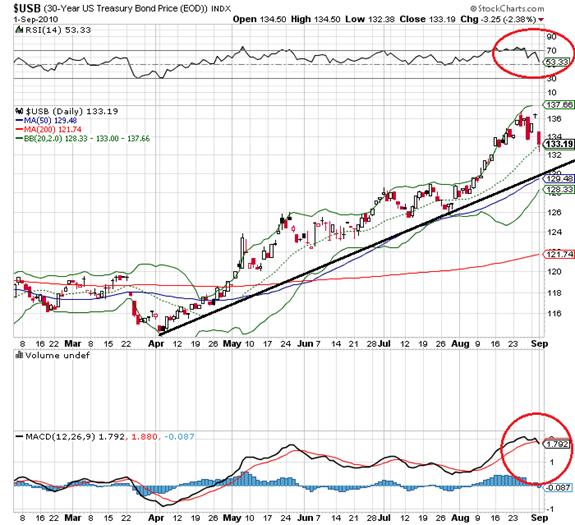
$USB: Again, if the stock markets are to go higher, than the safe haven trades should at least consolidate. Both the RSDI and MACD are trying to roll over to support that view.
My Watch List: Regardless of the bull, bear or crash view, it seems likely we trade higher near term. It’s to early to get excited about the inverse H&S until we're above the resistance area, but a move to that area is certainly a tradable move. Could the market do something very different all together? Sure, but these are the three prominent patterns or wave structures for the time being. The month of September should also be enough time to at least narrow one of the options out of the picture. Given that dynamic the long side trade should be the place until we have more price data. For a list of my trading candidates, please see tonight’s full blog at www.roseysoutlook.blogspot.com
Hope all is well.
By J.D. Rosendahl
www.roseysoutlook.blogspot.com
J.D. Rosendahl was a former stock broker/investment consultant (currently not licensed) before becoming a Commercial Banker for the past 14 years. He manages his family's wealth, helping them avoid the high tech bubble and the real estate bubble melt downs and preserving wealth.
© 2010 Copyright J.D. Rosendahl - All Rights Reserved
Disclaimer: The above is a matter of opinion provided for general information purposes only and is not intended as investment advice. Information and analysis above are derived from sources and utilising methods believed to be reliable, but we cannot accept responsibility for any losses you may incur as a result of this analysis. Individuals should consult with their personal financial advisors.
© 2005-2022 http://www.MarketOracle.co.uk - The Market Oracle is a FREE Daily Financial Markets Analysis & Forecasting online publication.