Stock Market Emulating 1930's Crash Pattern
Stock-Markets / Financial Crash Oct 11, 2010 - 11:25 AM GMTBy: Captain_Hook
 Damn The Economic Torpedoes – It’s Fiat Nirvana Or Bust - Little doubt can exist US central planners intend to go the full nine yards in attempting to overt a repeat of Japan over the past twenty years. We know this because the Fed told us in it’s last meeting it’s prepared to do anything to avoid such an outcome, which for them means they are willing to turn the screws on the printing presses without limit. Hence the title attempting to capture the condition our condition is in, damn the torpedoes – it’s fiat nirvana or bust – where just about every observer on the planet thinks such an outcome is now baked in the cake. This is of course a very dangerous condition sentiment wise, which we will expand on below. However for now it looks as though monetary authorities will pull it off, as many believe the markets are still in a position to accommodate such thinking.
The following is commentary that originally appeared at Treasure Chests for the benefit of subscribers on Tuesday, September 28th, 2010.
As alluded to above however, such a condition could not last forever, and if the people over at the Global / Europe Anticipation Bulletin are correct, according to their latest public bulletin, the same brand of austerity being forced on the lesser economies of the world right now will find its way to the States by next spring, and like it or not conservation will be forced on America, with dire implications for its stock and debt markets as this would accelerate the contraction in the larger credit cycle presently underway. So again, this is why the Fed will undoubtedly open the monetary floodgates sooner than later as the economy continues to stumble, where it’s estimated it will need to monetize some $3 trillion in Treasures over the next year in order to maintain the illusion.
This is why it’s almost humorous to see Obama and the other donkeys in Washington talking tough with China over matters that are better left to markets. These guys are only going to make matters worse in the end, because China is not going to take a slap in the face like this sitting down. Here, expect purchases of Treasuries to slow even further, meaning even more domestic monetization will be necessary to maintain the illusion. (i.e. low interest rates.) And maybe the Chinese will pull-off something even more radical, like threatening a demand payment in gold for its exports to solve the apparent currency disparity. As Fekete points out in the above, “all the trump cards are in the Chinese hand”. And the people at the top over there are not in the habit of getting ‘rail-roaded’, so expect something out of them in retaliation for what they must view as an insult.
Now you may better understand why gold and silver keep rising despite being overbought from a short-term technical perspective, because they are the only refuges left from political mishap (see above), unbridled currency depreciation, and other compelling reasons that transcend technical analysis. Obama and the boys appear bound and determined to start an all out trade / currency war that will end badly for the States no matter how its played in the media at home. Gold’s resilience at $1300 yesterday is proof of this in spite of a COMEX options expiry that would have normally sent prices down at least $50 previously, if not more. Instead, the bankers had to pay out on a vast amount of calls written under $1300, which is a sign that both the economy is suffering from extreme stress (meaning fiat currencies will have to be devalued increasingly, which is now happening on a worldwide basis), and people are simply exiting our out of control fiat currency economy (think hyperinflation) for whatever reason. (i.e. just think about Obama and his merry band of idiots.)
So, don’t be surprised if gold breaks above $1300 tomorrow, as it appears it would already be doing so if it were not for it being pinned at this strike due to the almost 13,000 calls set to expire today. On the other hand, if the buying today is just hedge funds padding the expiry because they are attempting to max out on their large call positions gold (and silver) could also sell-off, which would be equally unsurprising considering the metals are short-term overbought and could use a correction. In this regard it appears like a hedge fund related quarter end jam job is set to define the short-term trends in equities, fixed income, and possibly precious metals as well. Thus, even if they do rise tomorrow, come Thursday, one should be out of short-term trading positions. Of course if prices ignore all this, we would know the precious metals mania is on in full force, on its way to an eventual physical gold only (and silver) market at some point in the offing.
Along these lines, and in bringing in observations pertinent to the larger equity complex in attempting to put the pieces of the puzzle together, it should be noted strong moves higher in the stock market during September (with this being the strongest move since 1939) have always been followed by some degree of pullback in October, so I see no reason why this year would not repeat in knowing the primary reason it’s rising is fund (hedge and mutual) quarter end window dressing. So again, a pullback in stocks, commodities, and precious metals should be no surprise during October, with the dollar ($) trading higher. It should be noted with everything else favoring the bulls (technicals, fundamentals, etc.) that the open interest put / call ratio on GLD has been rising considerably over the past few days however, meaning speculators are selling calls, which is bullish from a contrarian perspective. This means any downside should prove temporary, meaning buying could return prior to the November election after a correction.
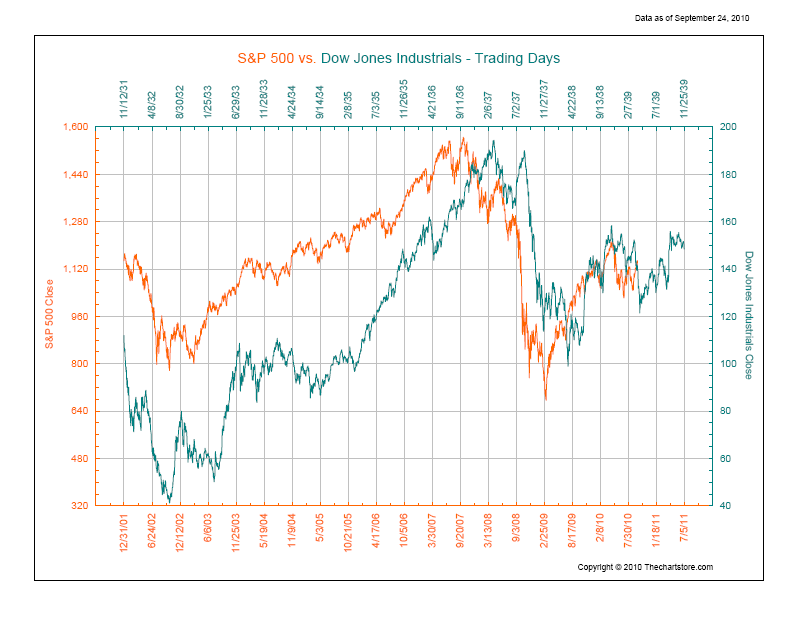
In looking further back in history for clues as to how the future will resolve, one cannot help but be impressed with how close the present post crash pattern in US stocks is compared to that of the 30’s, with the modern day S&P 500 (SPX) put against the latter day Dow in Figure 1 below. Here, if history is to repeat, stocks should peak any day now and begin to fall. Of course with the Fed fighting this propensity (printing increasing quantities of new currency), and short interest on stocks at high levels (along with still buoyant open interest put / call ratios on US indexes), it’s difficult seeing much downside moving forward at this time. Hence, the pattern in Figure 1 could represent a close approximation of what we should expect. This means a sharp dip into October, after hedge fund related quarter end propping ceases, and then a quick recovery back up to present levels. (See Figure 1)
Figure 1

Source: The Chart Store
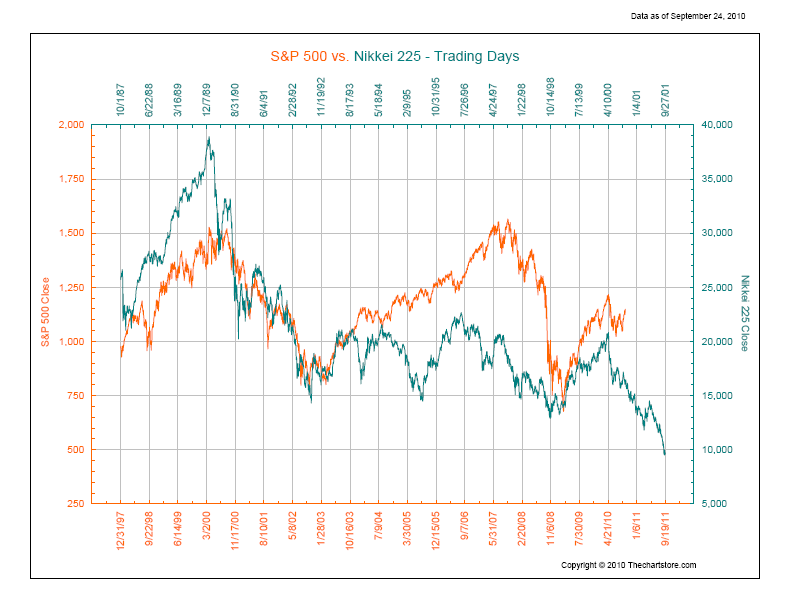
Based on the sentiment and liquidity pictures at present then, the above scenario appears most probable at this point, however it should be realized that both of these conditions are temporary, and will change given enough time. Here, it should be noted that if there is one thing history has taught us is human behavior associated with extreme manias, like the one currently underway, has a tendency to repeat. What’s more, it has also taught us that with specific reference to the measures central planners in the States are implementing to overt a more natural outcome, despite such efforts (printing money), Mother Nature will have her way eventually, meaning stocks will decline in spite of the best man made plans. This reality is well reflected in Figure 2 below, where it should be noted if history is to repeat in maintaining an eventual pattern match, that while US stocks could continue to diverge higher like into the bubble top witnessed in 2008, at some point such a move would fail, and the gap with the post crash Nikki closed, sending the SPX down into the 500 range. (See Figure 2)
Figure 2

Source: The Chart Store
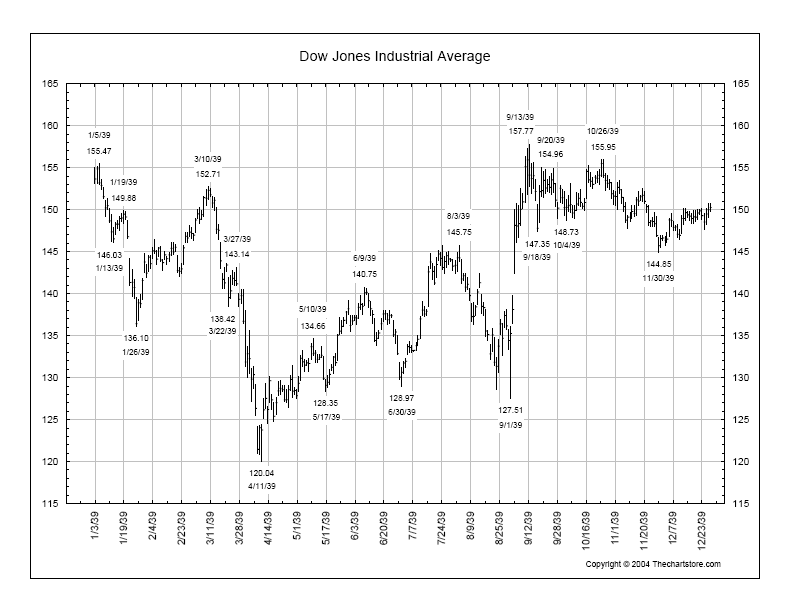
How could this be possible with the Fed ready to force the inflation issue on the rest of the world? Answer: In two words – forced austerity. At some point, which again, according to the Global / Europe Anticipation Bulletin attached above is next spring, in stead of the US forcing it’s bad paper (inflation) on the rest of the world, the world (credit markets) will finally have had enough of this and begin forcing the US to pay for it’s monetization practices with rising interest rates, which of course would end the game given such an outcome would balloon deficits (debt to GDP, etc.) to unmanageable levels. Coincidentally, it should be noted even if the Dow’s post crash pattern from the 30’s prevails, which does appear probable given liquidity and sentiment conditions, that after a peak in stocks by the end of September (and after a record rise like in 1939), they go sideways into year’s end, but continue to look promising for 2011. (See Figure 3)
Figure 3

Source: The Chart Store
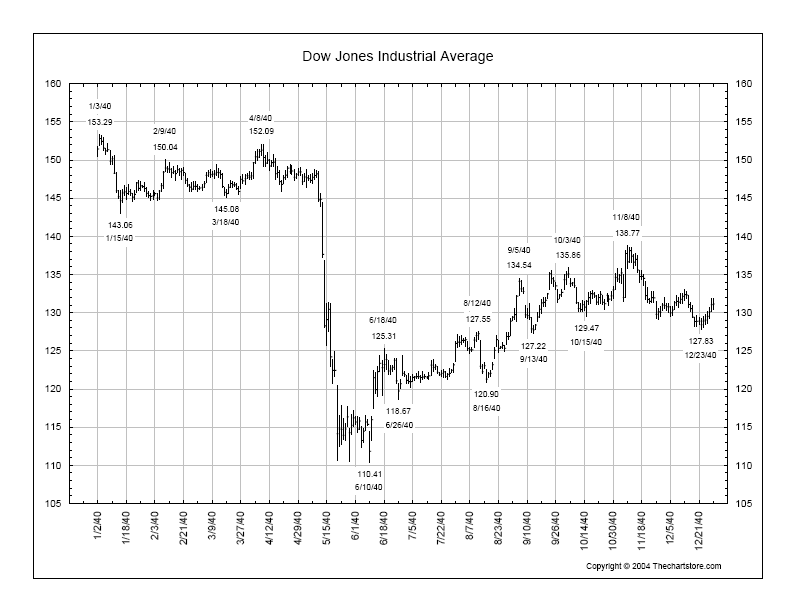
As per comments above however, in spite of man’s best made plans, losses and decay in the system / economy continue anyway, and this, combined with the forced austerity (think China actually selling Treasuries as tensions increase) placed on US credit markets eventually cause stocks to collapse lower, given if history repeats it would take all the way until May of next year for this to occur. And it should be noted that this timing falls within the timeframe it took the last SPX divergence to the Nikki to run its course, bringing the proper dimensions of the potential decline into a good light. (See Figure 4)
Figure 4

Source: The Chart Store
Unfortunately we cannot carry on past this point, as the remainder of this analysis is reserved for our subscribers. Of course if the above is the kind of analysis you are looking for this is easily remedied by visiting our web site to discover more about how our service can help you in not only this regard, but also in achieving your financial goals. As you will find, our recently reconstructed site includes such improvements as automated subscriptions, improvements to trend identifying / professionally annotated charts, to the more detailed quote pages exclusively designed for independent investors who like to stay on top of things. Here, in addition to improving our advisory service, our aim is to also provide a resource center, one where you have access to well presented 'key' information concerning the markets we cover.
And if you are interested in finding out more about how our advisory service would have kept you on the right side of the equity and precious metals markets these past years, please take some time to review a publicly available and extensive archive located here, where you will find our track record speaks for itself.
Naturally if you have any questions, comments, or criticisms regarding the above, please feel free to drop us a line. We very much enjoy hearing from you on these matters.
Good investing all.
By Captain Hook
http://www.treasurechestsinfo.com/
Treasure Chests is a market timing service specializing in value-based position trading in the precious metals and equity markets with an orientation geared to identifying intermediate-term swing trading opportunities. Specific opportunities are identified utilizing a combination of fundamental, technical, and inter-market analysis. This style of investing has proven very successful for wealthy and sophisticated investors, as it reduces risk and enhances returns when the methodology is applied effectively. Those interested in discovering more about how the strategies described above can enhance your wealth should visit our web site at Treasure Chests
Disclaimer: The above is a matter of opinion and is not intended as investment advice. Information and analysis above are derived from sources and utilizing methods believed reliable, but we cannot accept responsibility for any trading losses you may incur as a result of this analysis. Comments within the text should not be construed as specific recommendations to buy or sell securities. Individuals should consult with their broker and personal financial advisors before engaging in any trading activities, as we are not registered brokers or advisors. Certain statements included herein may constitute "forward-looking statements" with the meaning of certain securities legislative measures. Such forward-looking statements involve known and unknown risks, uncertainties and other factors that may cause the actual results, performance or achievements of the above mentioned companies, and / or industry results, to be materially different from any future results, performance or achievements expressed or implied by such forward-looking statements. Do your own due diligence.
Copyright © 2010 treasurechests.info Inc. All rights reserved.
Unless otherwise indicated, all materials on these pages are copyrighted by treasurechests.info Inc. No part of these pages, either text or image may be used for any purpose other than personal use. Therefore, reproduction, modification, storage in a retrieval system or retransmission, in any form or by any means, electronic, mechanical or otherwise, for reasons other than personal use, is strictly prohibited without prior written permission.
Captain Hook Archive |
© 2005-2022 http://www.MarketOracle.co.uk - The Market Oracle is a FREE Daily Financial Markets Analysis & Forecasting online publication.


