


The Big Bullish Elliott Wave Picture for Stocks
Stock-Markets / Stock Markets 2010 Oct 13, 2010 - 10:43 AM GMTBy: David_Banister
 Back in late February 2009 I decided enough was enough, and I stuck my neck out and called for a massive bull market in stocks. I based this prediction purely on Elliott Wave patterns I identified as bottoming and the sentiment gauges were off the charts bearish. We had not seen sentiment that negative since the 2002 lows. The re-tracement of the SP 500 over the eight odd years was a textbook Elliott Wave pattern, and frankly I think I was the only person who noticed the significance of the 666 low as it related to the 1974 SP 500 lows to 1999/2000 highs. Why was that 666 number so significant and a key indicator of a major bear market cycle low? Well the reason is that marked a clear wave 2 elliott wave bottom both in price, and sentiment, and time all at once.
At that level, the SP 500 believe it or not, had retraced an exact 61.8% Fibonacci retracement of the 1974 lows to the 1999 highs. That was very significant in that the market bottomed right there, and then began rallying upwards. At that point, it confirmed what I predicted in February of 2009, that we would begin a massive bull market up in stocks. The correction from the 1999-2000 highs lasted about 8 fibonacci years roughly, and retraced 61% (Fibonacci golden ratio) of the 25 year advance. Everyone was bearish at the lows, again, a confirming piece of evidence to get long in the winter of 2009. That brings us forward in this new bull market to October, 2010. Clearly, we bottomed in March of 2009 at 666, but it was not random at all.
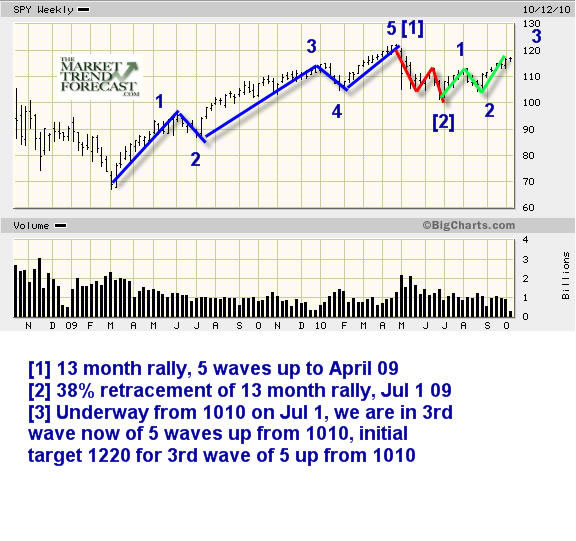
We are now in the early stages of a big wave 3 up in the markets. Wave 1 ended in April 2010 (A 5 wave structure completes a large wave 1 pattern). Then wave 2 corrected in A B C fashion, which had a 38% fibonacci retracement of the prior 13 month rally. That completed wave 2 down into July 1st, and sentiment again was horrible at the recent 1040 pivot.
Now, a wave 3 structure (5 total waves) to the upside begins at 1010 on July 1st with a move to 1130, then a wave 2 to 1040, and now a wave 3 up still in progress to 1220 if I’m right. Bottom line is the long term trends are bullish until the wave patterns materially change. Once 1220 is hit, we likely get a pullback wave 4 down, then a 5th wave up to new highs past the April 2010 highs.
Below is the simplest of SP 500 charts with some basic Elliott Wave labels. Getting complex with Elliott Wave forecasting is not a good idea: Best to you and your trading!
Consider subscribing while our Charter Rates are still in effect! Check us out at www.MarketTrendForecast.com
Dave Banister
CIO-Founder
Active Trading Partners, LLC
www.ActiveTradingPartners.com
TheMarketTrendForecast.com
Dave Banister is the Chief Investment Strategist and commentator for ActiveTradingPartners.com. David has written numerous market forecast articles on various sites (SafeHaven.Com, 321Gold.com, Gold-Eagle.com, TheStreet.Com etc. ) that have proven to be extremely accurate at major junctures.
© 2010 Copyright Dave Banister- All Rights Reserved
Disclaimer: The above is a matter of opinion provided for general information purposes only and is not intended as investment advice. Information and analysis above are derived from sources and utilising methods believed to be reliable, but we cannot accept responsibility for any losses you may incur as a result of this analysis. Individuals should consult with their personal financial advisors.
© 2005-2022 http://www.MarketOracle.co.uk - The Market Oracle is a FREE Daily Financial Markets Analysis & Forecasting online publication.