


Gold Nudging $1400, $1600 Not Far Away, $2,600 is Not Impossible
Commodities / Gold and Silver 2010 Nov 07, 2010 - 11:20 AM GMTBy: Merv_Burak

 We’re just nudging up against the $1400 mark, can $1600 be far away? That still seems to be the most talked about target although $2600 is not all that impossible. Let’s see where we are at the present time, technically speaking.
GOLD : VERY LONG TERM
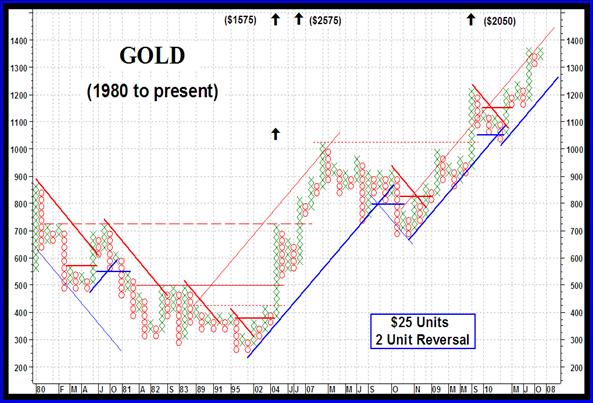
With gold once more on the move and on everyone’s mind let’s take a look at the very long term point and figure (P&F) chart and see how we get some of our projections as to where we think gold might go, technically speaking.
For those who may not be familiar with my very simple P&F technique, the red down trend lines are bear market moves while the blue up trend lines are bull market moves. The thicker the line the more important is the line. For a bull market signal I need the Xs to break above the primary down trend line AND above two previous X highs. For a bear signal I need the Os to break below the primary up trend line AND below two previous lows. There, that’s almost a complete point and figure course in a matter of a few lines. The only other main consideration is how to calculate a price projection once a move is on its way. The main consideration is, of course, the extent of a bull move. Shown on the chart are horizontal lines. The very thick solid lines are the break-out lines mentioned above. The lesser horizontal lines are used to calculate the various projections. To calculate a price projection we usually use what is referred to as a horizontal count. We count the number of columns in a significant consolidation period, from the right side wall of Xs to the left side wall of Os (although occasionally the left side may be a wall of Xs). Multiply this number by the unit value and then multiply that result by the unit reversal number. Add this total to the lowest price within the consolidation period being examined and you get the projection based upon that consolidation. You could have more than one projection as is shown here. There, that’s all there is to it and we technicians get a lot of money for this fancy footwork.
Since $25 this way or that way doesn’t mean much when we are talking in the $1000 range the projections are often simplified to the nearest round $100 or $50 unit. So, here we see where we get the $1600 projection and the $2600 projection (with a mid projection at $2050).
With a change in the units used and/or the unit reversal criteria we can get P&F charts to represent more aggressive market action or even less aggressive action, whatever one might wish. Each such chart may provide different projections although I do get a projection to $2075 using a long term (versus a very long term) chart so the $2050/$2075 looks like a good number for after we get to the $1600 level and before we get to $2600.
LONG TERM
Back to the normal indicators and analysis. As noted in earlier commentaries we had a long term projection to the $1395 level, which was met this past week. Our concentration is now on that $1600 level, P&F wise.
With the market action over the past week or so one should not be surprised that everything is positive. During times such as this we then turn our attention to see if there are any signs of concern ahead. For now the price of gold is well above its long term positive moving average line. The long term momentum indicator remains in its positive zone and although it was below its negative trigger line for a short time it is once more above the trigger and the trigger has turned back to the up side. However, one minor (at this time) warning is provided by the indicator. It remains below its level from a few weeks back even though the gold price has moved into new highs. This is not yet serious and one would not act on this warning yet but it is something to keep in your thoughts. As for the volume action, the volume indicator has been moving in all time high territory above its positive sloping trigger line. All is still in place for a BULLISH long term rating.
INTERMEDIATE TERM
It’s no surprise that everything from the intermediate term is positive. Gold remains above its positive moving average line. The intermediate term momentum indicator remains in its positive zone and although it was below its trigger line for a while it is once more above the trigger and the trigger has turned to the up side. As with the long term momentum indicator the intermediate term indicator is still below its level of a couple of weeks back for a minor warning of weakness in the gold price move, but only a minor warning at this time. The volume indicator remains in a positive trend above its positive sloping trigger line. All in all the intermediate term remains BULLISH. The short term moving average line remains comfortably above the intermediate term line for confirmation of the bull.
SHORT TERM
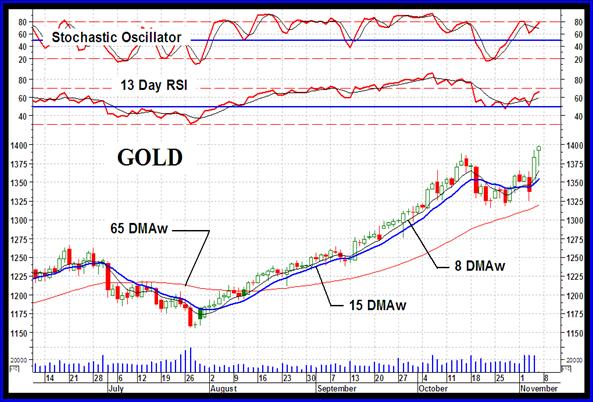
The short term chart and momentum indicator shows us the weakness in the momentum of the recent price move into new highs. The momentum is significantly reduced versus the price action. This usually is a warning not to expect too much from the price move but DOES NOT predict when the move will end. That could be tomorrow or next week. For now the status of the indicators is still positive. The price is once more back above its moving average line and the line has turned upwards. The momentum indicator, although giving us a warning, is in its positive zone and has moved above its now positive trigger line. As for the daily volume activity, that seems to be okay for now. The past three days were heavy even though one of the days was a down day. Putting it all together we still have a BULLISH rating for the short term. The very short term moving average line is once more above the short term line for confirmation of this bull.
As for the immediate direction of least resistance, that may be about to turn downwards but still the trend is upward. The Stochastic Oscillator is up against its overbought line and reversals have been known to originate at about this SO level. Friday’s candlestick pattern is what is referred to as a “hanging man” pattern. It is the same as a hammer pattern but a hammer occurs during a down trend and is bullish while a hanging man occurs during an up trend and is bearish (or at least that’s what the book says). So, it looks like the down side ahead but I would expect a day or two of lateral drift before the down side takes hold.
SILVER
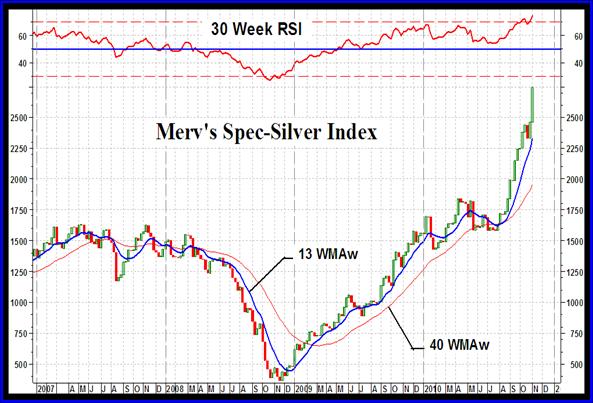
As those of you who may be following the various Indices in the Table at the end of these commentaries realize, the speculative silver stocks have really been on the move. My two silver Indices are the Merv’s Qual-Silver Index, which is composed of the 10 largest quality silver stocks traded on the North American markets, and the Merv’s Spec-Silver Index, which is composed of 25 more speculative silver stocks. The chart today is that of the Merv’s Spec-Silver Index. It is well into all time high territory and has increased almost 650% since reaching its low point in late 2008. Looking at the Index another way it is 74% above its previous all time high reached in 2008 at the previous bull market top. These performances reflect the AVERAGE performance of the 25 component stocks, calculated on a weekly basis. By comparison the Merv’s Qual-Silver Index of quality silver stocks has not yet reached new all time highs. It is still 5% below its 2008 top but is ahead 290% above its late 2008 low.
I know that very many of you reading these commentaries have been propagandized into believing that one should only “invest” in “quality” stocks because the more speculative stocks are too darn risky. That’s okay, to each his own, whatever makes you happy, and all that stuff. However, I think that to neglect the super potential of the more speculative stocks is not all that sound. You do not need to plunge in and devote all your capital on one long shot, that IS stupid, but one might give more thought to spreading their capital into some speculative stocks for those potentially huge gains. But if speculating ALWAYS remember that these stocks have a habit of turning around fast so one MUST have exit strategies BEFORE speculating and act on those strategies. Get in fast, get out fast, and don’t complain if you make a mistake. Mistakes happen, the intelligent speculator understands this, the stupid loser does not. Unfortunately, losers will always be with us but hopefully those reading these commentaries are not among them.
One final word when talking about the “quality” versus the speculative, The Merv’s Qual-Silver Index lost 76% of its value during the 2008 bear market while the Merv’s Spec-Silver Index lost 77% of its value. Not much difference on the down side versus the potential on the up side, eh!
PRECIOUS METAL STOCKS
I’ll leave commentary on the precious metal stocks for next week. However, it is interesting to note that ALL of my various gold and silver Indices have their long term momentum indicators now inside their overbought zones. One should now be expecting a stock decline or at least a rest period. It is at the point of being very risky to be on the buy side now. No need to accept too much risk. Potentials are not going to disappear if you are out of the market for a while but at this point in time one might just be better of taking a rest himself, having a beer and watch your favorite movie or TV program.
Merv’s Precious Metals Indices Table
Well, that’s it for this week. Comments are always welcome and should be addressed to mervburak@gmail.com.
By Merv Burak, CMT
Hudson Aero/Systems Inc.
Technical Information Group
for Merv's Precious Metals Central
For DAILY Uranium stock commentary and WEEKLY Uranium market update check out my new Technically Uranium with Merv blog at http://techuranium.blogspot.com .
During the day Merv practices his engineering profession as a Consulting Aerospace Engineer. Once the sun goes down and night descends upon the earth Merv dons his other hat as a Chartered Market Technician ( CMT ) and tries to decipher what's going on in the securities markets. As an underground surveyor in the gold mines of Canada 's Northwest Territories in his youth, Merv has a soft spot for the gold industry and has developed several Gold Indices reflecting different aspects of the industry. As a basically lazy individual Merv's driving focus is to KEEP IT SIMPLE .
To find out more about Merv's various Gold Indices and component stocks, please visit http://preciousmetalscentral.com . There you will find samples of the Indices and their component stocks plus other publications of interest to gold investors.
Before you invest, Always check your market timing with a Qualified Professional Market Technician
Merv Burak Archive |
© 2005-2022 http://www.MarketOracle.co.uk - The Market Oracle is a FREE Daily Financial Markets Analysis & Forecasting online publication.