Stock Market Cycles Analysis - The Trend is still up, Sentiment is High, but Change is in the Wind
Stock-Markets / Cycles Analysis Jan 21, 2007 - 01:47 PM GMTBy: Tim_Wood
 Let me begin by explaining that in my work with the markets there are really two distinctly separate pieces. First, is what I call the "over the horizon" piece. This work utilizes the Dow theory, cycles and statistical trend quantifications, all to develop probabilities as to what likely lies ahead or "over the horizon" for a given market. The second piece of my work is primarily centered around my Cycle Turn Indicator. This indicator provides us with confirmation at important turn points. So, it tells us what we should expect now and in the immediate future. All the while, I am constantly watching and monitoring the longer-term "over the horizon" work as well. Sometimes, the intermediate-term work can evolve and change the longer-term forecasts, while other times it may confirm the longer-term forecast. So, this is an act of working two ends to the middle.
At present and contrary to popular opinion, the long-term work continues to suggest that the 4-year cycle low is still ahead of us. I know that most people are of the opinion that the 4-year cycle low occurred at the June/July 2006 lows. Those that were looking for the 4-year cycle low last October are all pretty much now also in the camp that the 4-year cycle low occurred at the June/July 2006 lows. But, my long-term "over the horizon" data originally told me back in January 2006 that the 4-year cycle low would not occur in the summer of 2006 or the fall of 2006. For over a year now this long-term work has been pointing into 2007 for the 4-year cycle low. I will admit that it originally suggested that the decline would begin in late 2006.
However, once we got into the fall of 2006 the intermediate-term work actually pointed to higher prices before the 4-year cycle top was made. This forecast is strictly based on statistical and trend quantification data and remains intact and on track today. With the markets I will admit that anything is possible so there is a chance that the low occurred in the summer, but the statistical data does not in any way support such an occurrence. Furthermore, the price action that has lead up into the current highs has actually been supported by these same statistical probabilities that surfaced in the fall and has not affected the longer-term expectations surrounding the ongoing setup of the current 4-year cycle.
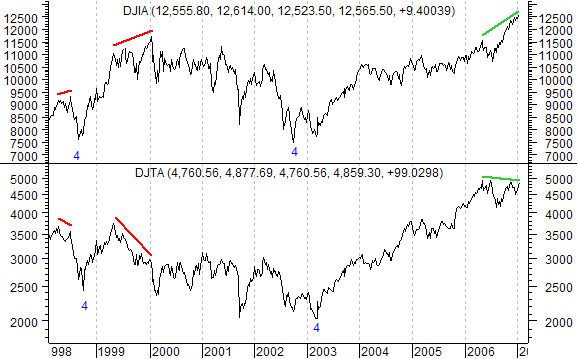
That being said, I want to take a quick look at Dow theory. Let me begin by saying that according to Dow theory, the trend is still positive. But, at the same time the ongoing non-confirmation between the Industrials and the Transports continues to warn of an approaching top. I have marked the current non-confirmation in green on the chart below. Understand that cycles are not a part of Dow theory. But, history does in fact tell us that 81% of all 4-year cycle tops have historically occurred in conjunction with a Dow theory non-confirmation. The last two such non-confirmations occurred at the 1998 4-year cycle top as well as the 4-year cycle top that occurred in 2000. Non-confirmations are not buy or sell signals. Non-confirmations do however serve to telegraph that a change is likely in the making and to be careful. Until this non-confirmation is corrected, it must be respected.

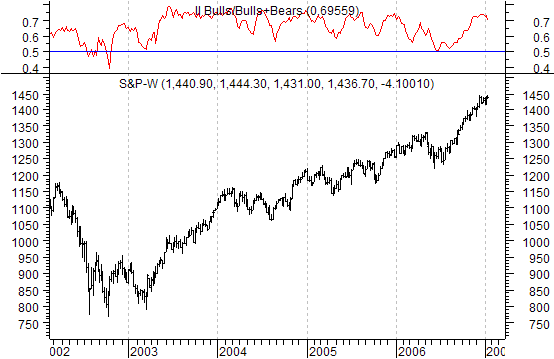
In spite of the Dow theory non-confirmation and the statistical quantifications surrounding the 4-year cycle, which are not discussed here, the public remains very bullish and completely oblivious to the current market risk. One measure of this sentiment comes from the Investor Intelligence data. Below is a weekly chart of the Industrials along with the weekly Investor Intelligence readings in the upper window. We have just completed the 222nd consecutive week with this reading either at or above the 50% level. When this indicator is at the 50% level it means that there are just as many bulls as there are bears. When this indicator is at 75% it is telling us that there are 3 times as many bulls as there are bears. The point here is that optimism among investors ebb and flow with market cycles. For example, since the inception of the Investors Intelligence data every 4-year cycle low has occurred with extreme pessimism. All the while, 4-year cycle tops are made with extreme bullishness and optimism. So, it is a fact that most people are the most bullish at or near a top and that most people are the most bearish at or near a bottom.
Please understand that just as with non-confirmations sentiment data does not yield buy and sell signals, but rather serve as an indication of the overall environment. Let me also add that since the inception of the Investors Intelligence data back in the 1960's there has never been a period of such persistent bullishness. Even during the bull market of the 1990's and into the 2000 top this level of consistent bullishness was not seen. At 222 consecutive weeks at 50% or more we are indeed at record bullishness. What this amounts to is that this entire 4-year cycle advance has occurred with the plurality of bulls over bears and that has never occurred before.

The danger here, as I see it, is that we now have far too many people on one side of the boat. When the decline into the 4-year cycle low does begin and this sentiment begins to shift, the heard will run to the other side, it's only human nature. With this level of consistent/persistent bullishness there is an awful lot of weight that will be running to the other side, which could exacerbate the move into the 4-year cycle low.
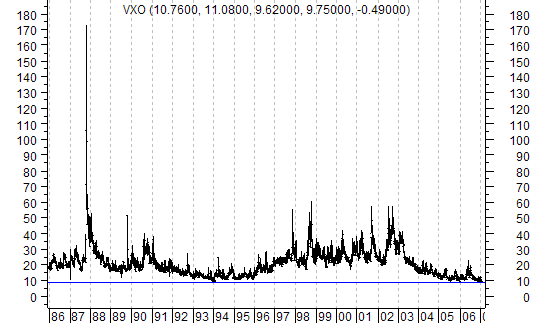
Another reason that there is so little fear amongst the public is that the market is now in its 7th consecutive month without a meaningful correction. This has in turn spawned off even more and more complacency. That complacency is not only reflected by the Investors Intelligence data, but also by the Volatility Indexes. As an example, the VXO, which is the old VIX and is plotted below, hit the lowest intra-day reading since 1993 back in December. Today, the VXO is still right at these record low levels. A high complacency rate equates to a low VXO reading, while fear relates to a high VXO reading.

No doubt about it, the price advance out of the summer low remains intact as of this writing and I do respect the current trend. But, at the same time, the "over the horizon" piece of the equation continues to tell me that storm clouds are in fact still gathering and I also must respect that fact as well. However, it seems that everyone is so blinded by the ongoing advance that they cannot see, or in most cases choose not to believe, that the market can go anywhere but up from here. This sort of reminds me of an e-mail I received in which a subscriber asked me why I didn't give my turn point on oil when it topped. Fact is, I did give the signal right near the top way back in August. Trouble was, she heard what he wanted to hear at the time and that was $100 oil, not $50 oil.
There was a refusal to believe the technical indicators. When I showed this documentation to the subscriber she did not remember it. Nor did she remember when I said that the rally out of the lows this past fall would be a counter trend bounce. Point being, people become opinionated and conditioned to think as a heard. Virtually no one is expecting anything but higher stock prices and I can count on less than one hand the people that I know who are in agreement that the 4-year cycle low still lies ahead. Yes, if you know what your looking at, the evidence of risk is fairly clear. Yet, I find it very interesting that so many are so complacent at this juncture. But then again, that's the nature of the markets, so this really does make perfect sense.
Should you be interested in solid factual quantitative analysis on the 4-year cycle, then you should consider Cycles News & Views. Such analysis and on going developments are far beyond the scope of these brief articles. I have put together a very detailed slideshow covering the statistics surrounding the current setup including time and price objectives. I cover not only the stock market but, the dollar, gold and bonds. I also report on other key markets at important turn points using my Cycle Turn Indicator and updates three times a week. A more recent call by the Cycle Turn Indicator was the down turn out of the December counter trend bounce in oil. If I could only have one indicator, it would be the Cycle Turn Indicator.
By Tim Wood
Cyclesman.com
Tim Wood specialises in Dow Theory and Cycles Analysis. To get the technical and statistical facts and know when significant turns come based on the ever so important Cycle Turn Indicator Visit www.cyclesman.com/testimonials.htm.
© 2005-2022 http://www.MarketOracle.co.uk - The Market Oracle is a FREE Daily Financial Markets Analysis & Forecasting online publication.


