


Stock Market 2011 Outlook Remains Bullish, Risk Assets Respond to QE
Stock-Markets / Stock Markets 2011 Dec 16, 2010 - 10:43 AM GMTBy: Chris_Ciovacco

 With even the ‘new normal’ crowd upgrading their economic forecasts for 2011, the Federal Reserve prepared to fully implement QE2, and Ben Bernanke leaving the door open for QE3, it is a good time to take a step back and look at the battle between the acceptance of risk and risk aversion.
This article and video provides updated versions of charts we have presented in recent months. The market has had several opportunities, from both a fundamental and technical perspective, to correct in recent weeks, but the bears have not seized the moment. Charts created months ago are leaning bullish, which bodes well for risk markets making higher highs in the months ahead. All charts are as of the Decemebr 10, 2010 close. A larger video player is available making it easier to read some of the charts.

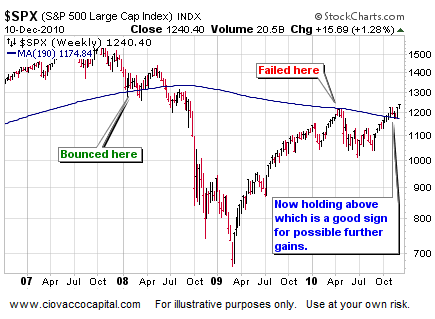
The spring 2010 rally was abruptly halted by numerous forms of resistance, including the 190-week moving average shown below (thin blue line). The S&P 500 has recently cleared and held above the 190-week. The chart below was first presented on December 2nd.
A similar concept is shown below with additional moving averages added to the chart. Not only has the market cleared resistance on the far right side of the chart below, but stocks also held at key levels of moving average support in July 2009, July 2010, and September 2010. When we first presented the chart below on October 13th with the S&P 500 at 1,170, we stated:
On the high end, a clean break above the 190-week MA (now at 1,184) and the 205-week MA (now at 1,201), could spark surprising gains to the upside.
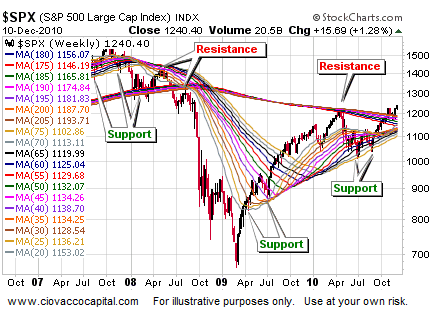
In the last seven weeks, the S&P 500 has cleared and retested important levels in the form of the 190, 210, and 275-week moving averages (shown in blue, red, and green below). The longer the market can hold above these levels, the more meaningful it becomes from a bullish perspective. The chart below was originally presented on December 2nd with these comments:
This band of resistance from the three MAs (green, red, and blue lines above) represents a significant test for both the current bull market and the Fed’s quantitative easing (QE) policy. A significant market failure at the band formed by the 190, 210, and 275-week moving averages may indicate global deflationary forces are stronger than the Fed’s printing press. A typical bull market would pause near these barriers, but eventually the primary uptrend would carry stocks to higher highs.
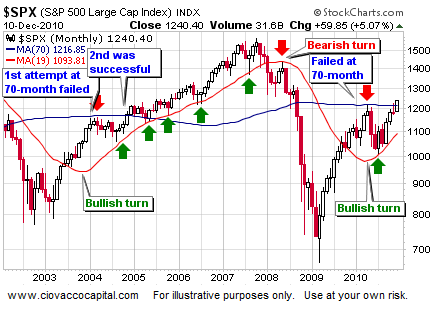
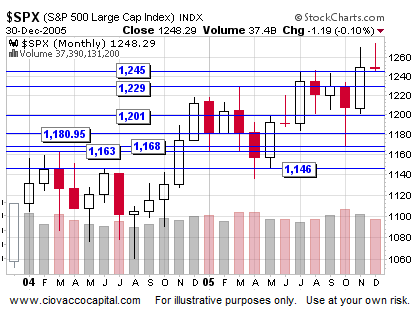
In the monthly chart below, notice how the 70-month moving average (blue line) acted as resistance on the first clearing attempt in 2004; the second attempt in 2004 was successful. The pattern in 2010 is similar thus far. The S&P 500 stalled at the 70-month in April 2010. If the S&P 500 can finish December above the 70-month (now at 1,217), it may open the door to significant gains just as it did in 2004-2007. The chart below was originally presented on October 14th with the S&P 500 at 1,178. These comments accompanied the original version of the chart below:
Prices recently held at the 19-month MA, which supports longer-term bullish outcomes. Notice how the 70-month MA (blue line) held back the first attempt to cross it in 2004. 2004 is a good comparison to the present day since we are in a similar part of the market, economic, and interest rate cycles. The second attempt to clear the 70-month MA was successful in 2004. In 2010, the first attempt at the 70-month MA failed (just like 2004). The market probably will make a second attempt at the 70-month MA before we close out 2010. The 70-month MA now stands at 1,216, which is near other logical forms of potential resistance. Given the relatively low odds of a double dip (less than 25%), the Fed’s near promise to print more money in the form of quantitative easing, and positive technicals, we believe the odds favor a break of the 70-month MA in 2010 or early in 2011.
As the updated version (as of 12/10/10) of the chart below shows, the S&P 500 has successfully cleared the 70-month moving average (blue line). The move becomes more meaningful if it can hold into early 2011.
With the S&P 500 trading at 1,200 on November 20th, we first posted the chart below along with the following:
Whether or not the S&P 500 can hold above its recent closing low of 1,178 remains to be seen, but there is ample evidence in hand to at least leave the door open to higher highs occurring between now and year-end.
The market did hold near 1,178, and as shown below in an updated version of the chart, recently broke out above the blue trendline.
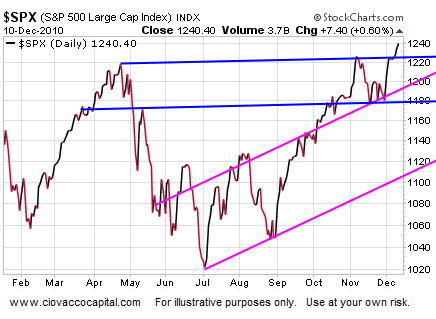
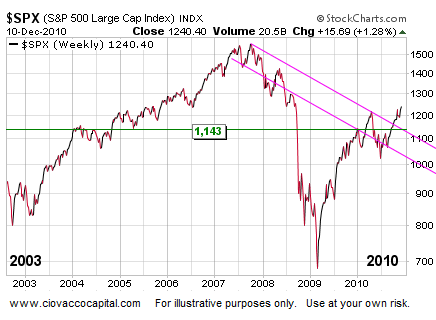
If we take a longer-term perspective, trend channels impacting price since the 2007 highs have also been cleared (see below) opening the door to possible further bullish activity in the first half of 2011.
On a weekly chart, the S&P 500 has cleared resistance at 1,220. The next level to watch on this chart comes in near 1,256, an area where sellers may surface for a time (see chart below).
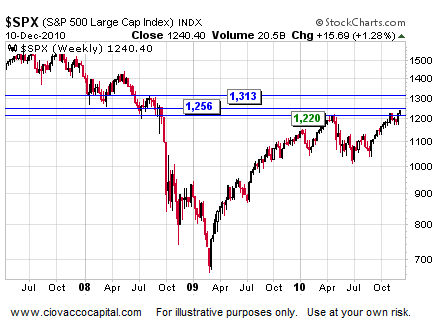
The next two charts look at areas of potential overhead resistance for the S&P 500. In 2004-2005, the area near 1,246 on a weekly chart acted as both resistance and support. This level may come into play again in 2010-2011.
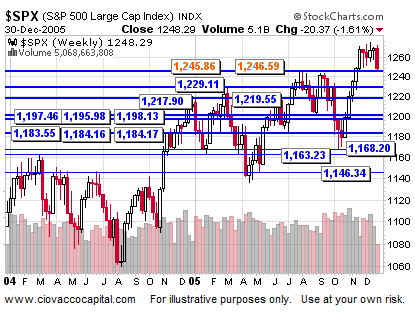
On a monthly chart, 1,245 also was important to market participants in 2004-2005, which reinforces the need to pay attention near this level in 2010-2011.
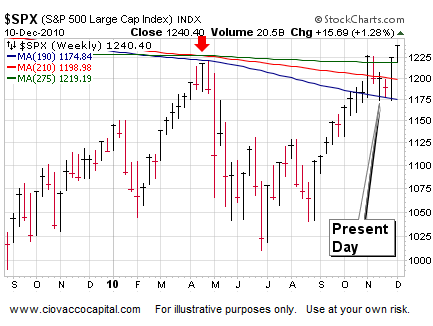
The S&P 500 closed on December 10th at 1,240.40 which is very close to three potential forms of resistance shown below. Given the bigger picture, we would expect any pause or correction near 1,240 to be within the context of an ongoing bull market.
This analysis relates to longer-term trends and does not leave the financial markets immune to normal corrections, which can be significant within the context of an ongoing bull market. As long as the key levels outlined above hold, the odds favor markets making higher highs in 2011. If these levels fail to hold, it may signal the deflationary forces in the global economy are gaining traction relative to the Fed’s printing press.
By Chris Ciovacco
Ciovacco Capital Management
Copyright (C) 2009 Ciovacco Capital Management, LLC All Rights Reserved.
Chris Ciovacco is the Chief Investment Officer for Ciovacco Capital Management, LLC. More on the web at www.ciovaccocapital.com
Ciovacco Capital Management, LLC is an independent money management firm based in Atlanta, Georgia. As a registered investment advisor, CCM helps individual investors, large & small; achieve improved investment results via independent research and globally diversified investment portfolios. Since we are a fee-based firm, our only objective is to help you protect and grow your assets. Our long-term, theme-oriented, buy-and-hold approach allows for portfolio rebalancing from time to time to adjust to new opportunities or changing market conditions. When looking at money managers in Atlanta, take a hard look at CCM.
All material presented herein is believed to be reliable but we cannot attest to its accuracy. Investment recommendations may change and readers are urged to check with their investment counselors and tax advisors before making any investment decisions. Opinions expressed in these reports may change without prior notice. This memorandum is based on information available to the public. No representation is made that it is accurate or complete. This memorandum is not an offer to buy or sell or a solicitation of an offer to buy or sell the securities mentioned. The investments discussed or recommended in this report may be unsuitable for investors depending on their specific investment objectives and financial position. Past performance is not necessarily a guide to future performance. The price or value of the investments to which this report relates, either directly or indirectly, may fall or rise against the interest of investors. All prices and yields contained in this report are subject to change without notice. This information is based on hypothetical assumptions and is intended for illustrative purposes only. THERE ARE NO WARRANTIES, EXPRESSED OR IMPLIED, AS TO ACCURACY, COMPLETENESS, OR RESULTS OBTAINED FROM ANY INFORMATION CONTAINED IN THIS ARTICLE. PAST PERFORMANCE DOES NOT GUARANTEE FUTURE RESULTS.
Chris Ciovacco Archive |
© 2005-2022 http://www.MarketOracle.co.uk - The Market Oracle is a FREE Daily Financial Markets Analysis & Forecasting online publication.