


Stocks Market Targets Short Term SPX Correction
Stock-Markets / Stock Markets 2011 Jan 03, 2011 - 06:01 AM GMTBy: Andre_Gratian

 Current Position of the Market
Very Long-term trend - The very-long-term cycles are down and if they make their lows when expected, the secular bear market which started in October 2007 should continue until about 2014-2015.
Long-term trend - In March 2009, equity markets began an upward corrective move in the form of a mini bull market. Cycles point to a continuation of this trend into 2011.
SPX: Intermediate trend.Technical observations point to a potential top in late December which will most likely only bring about a short-term correction, but could turn into an intermediate decline.
Analysis of the short-term trend is done on a daily basis with the help of hourly charts. It is an important adjunct to the analysis of daily and weekly charts which discusses the course of longer market trends.
Overview:
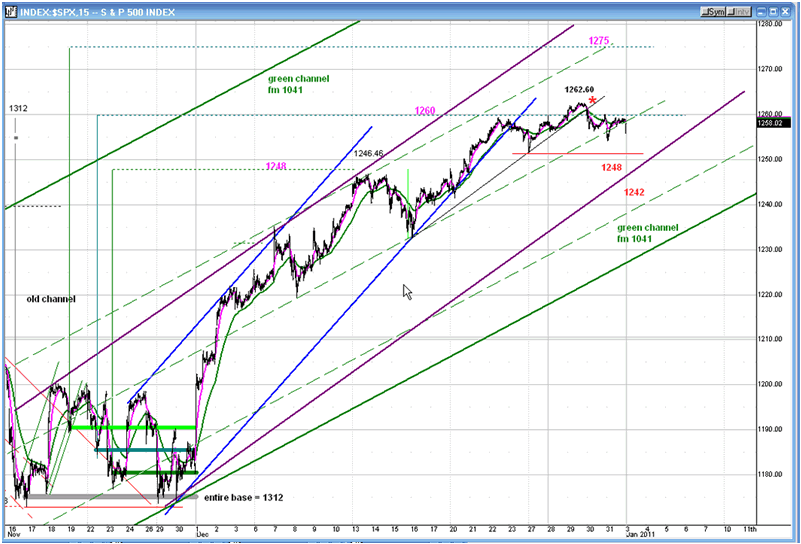
The SPX had a minor correction after approaching its 1248 target, and then went on to meet the next projection of 1260, even surpassing it by a couple of points before finding some resistance. Year-end seasonal bullishness and corrective action in the dollar kept the index afloat to the end of the year, but it should now begin a small decline into the short term cycles due in the next few days.
Let's first look at the projection chart. The entire Point & Figure base calls for a potential move to 1312. Although 1248, 1260, and 1275 are only interim projections, they are all capable of bringing about a reversal to the trend which started at 1041. This is why it is important to examine the market position closely as each target is met in order to determine if only a consolidation is taking place, or if it is the end of the prevailing trend.
Should a decline into the cycle lows occur, the distribution which formed at the 1258-1259 levels has the potential of taking prices down to 1248, and perhaps even 1242. What happens afterwards will determine if the rally continues, or if this short-term top evolves into an intermediate one.
On the following chart, the green channel represents the intermediate uptrend from 1041. As the uptrend momentum weakened, the index moved outside of the blue secondary channel, but was still contained within the purple channel, as well as the main green channel. A minor correction could first move the index outside of the purple channel, and higher prices may be reached before there is a reversal out of the intermediate trend channel.
Analysis
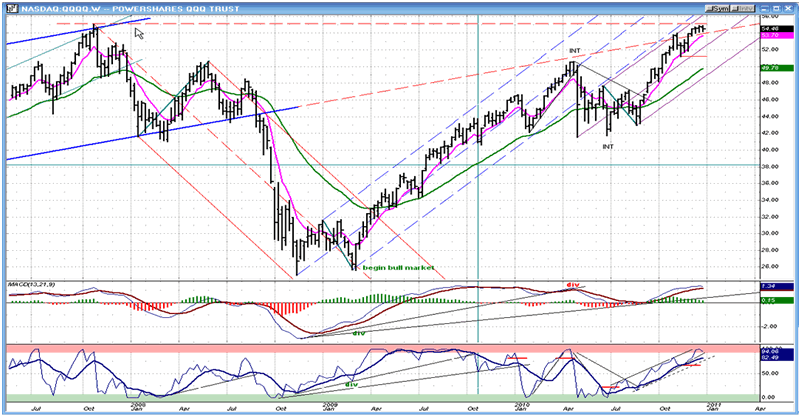
Now that we have gotten a feel for what the SPX is doing, analyzing the QQQQ might give us a better perspective on the current market position. We'll start with the Weekly Chart (above).
The index appears to adapt itself exceptionally well to Andrews pitchfork channels. This technique encompassed perfectly the decline from the October 2007 high. It also worked for the intermediate trend from the March 2009 low to the April 2010 top (blue dashed lines). And now, another channel has formed from the July lows. We'll examine it in more detail on the Daily Chart, but first let's look at the weekly indicators. The momentum index is in the red overbought zone, but neither indicator is showing divergence to price. Consequently, any pull-back from here is unlikely to be the end of the trend from the 2009 lows.
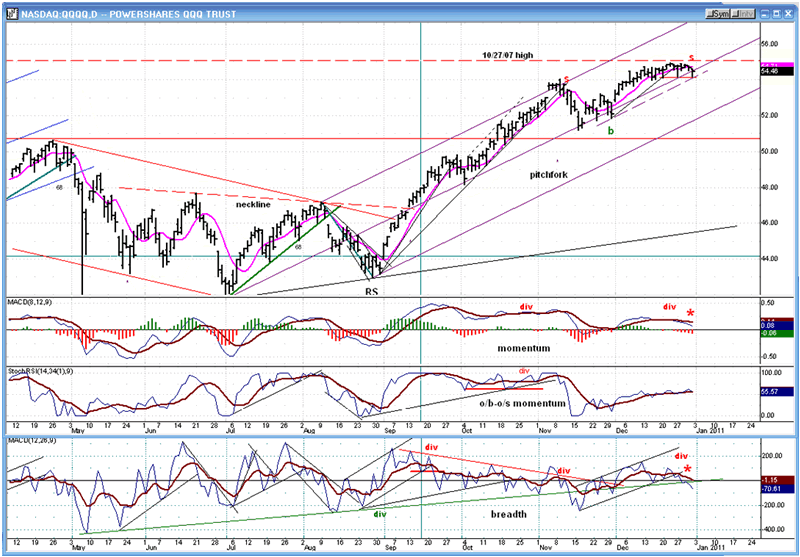
On the second (daily) chart above, we can better see how well the Andrews pitchfork (drawn from the July lows) traces the uptrend from that time frame. What is also very obvious is the trend deceleration which is taking place. The index met resistance at its 2007 high, and this kept it from going all the way to the top of the channel. It is now in the process of breaking through the median. The weakening trend is evident in the middle indicator, but my decision to label the index a short-term sell was based on the position of the other two indicators, as well as the price action. A confirmation will come as soon as the red horizontal line has been penetrated to the downside.
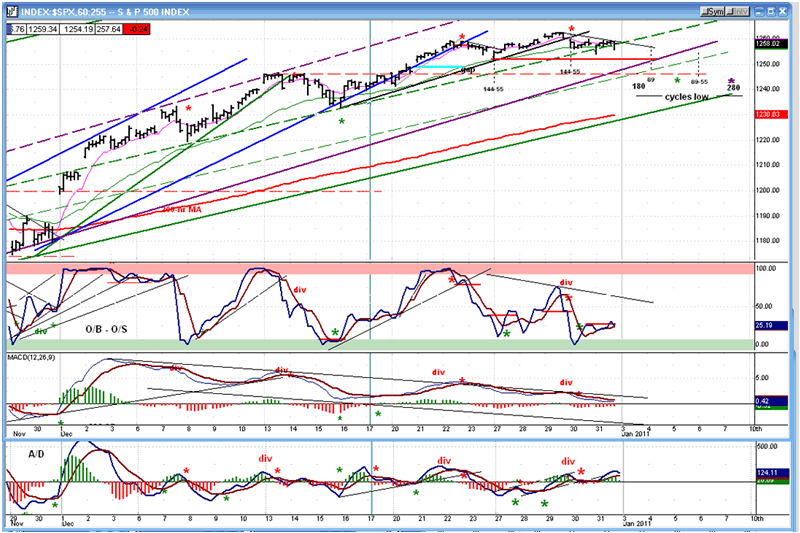
Now, let's zoom in on the SPX Hourly Chart for some near-term analysis. There are some short-term cycles due to make their lows directly ahead which should cause prices to decline for the next few days but, as of Friday, even though the index began to retrace after touching 1262, not even a near-term decline has been confirmed. For that, the index would need to break the former low of 1252, and the A/D indicator (bottom) would need to give a sell signal.
The dollar, which has been correcting its recent advance, has minimized the downward pull of the cycles. It will probably have to stabilize and even bounce in order to allow the index to meet its 1248-1242 targets.
What happens after the cycles have made their lows will determine if we simply expand the top, or continue to rally toward the higher projections (1275-1312).
Cycles
Short-term cycles bottoming over the next few days include the 180 calendar day, the 13 trading day, and the 40 trading day cycles.
Long-term cycles (7-yr, 6-yr, 4-yr, 2-yr) are up until 2012, but could turn down earlier as a result of the pressure exerted by the very long cycles. From a cyclic perspective, we should start to expect the end of the bull market after mid-2011.
The very long cycles (120-yr, 40-yr etc...) are down and due to bottom in 2014-15.
Projections
The SPX has met its 1260 projection and should now pull-back into the cycle lows.
The small distribution pattern established at 1258-59 has generated potential targets of 1248 and 1242.
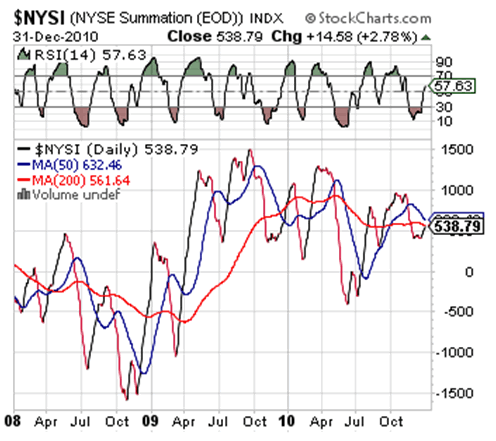
Breadth
The NYSE Summation Index (courtesy of StockCharts.com) is now showing some definite negative divergence relative to the SPX. If this is not erased quickly by more strength in the A/D, the equity indices are at risk of making an intermediate-term top.
Sentiment
The SentimenTrader (courtesy of same) long-term index remains only moderately negative.
The VIX continued to decline until it reached the levels seen at the April top. It has now started to rebound in an uptrend which still lacks conviction and will probably move a little higher as the market declines into the cycle lows before expanding its base. In a couple of weeks, it may be more ready to start a genuine uptrend.
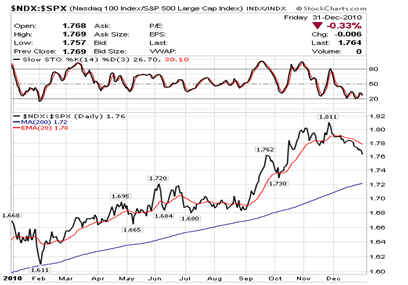
It is fairly well documented that the NDX has a tendency to lead the SPX up or down. As you can see above, the trend deterioration which shows in the QQQQ chart led the index to underperform the SPX. This confirms what I expect of the market for the near term.
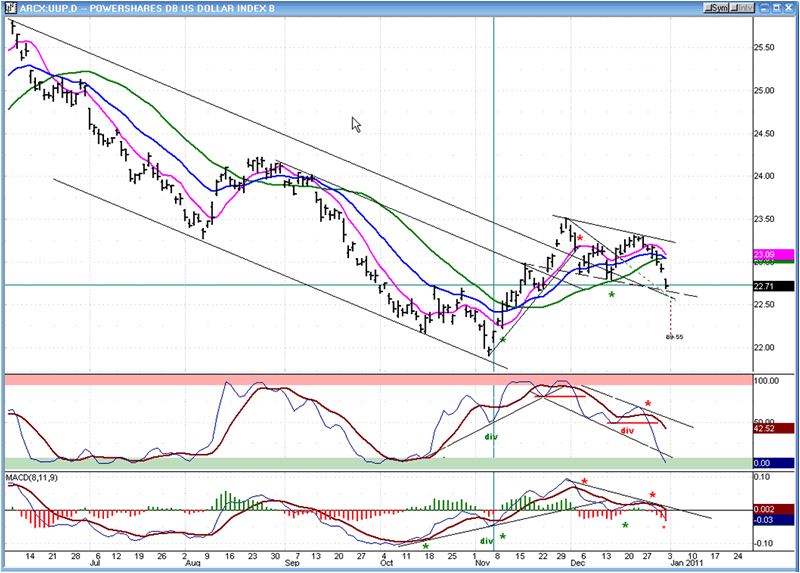
Dollar index
The dollar ETF (UUP) is correcting and, except for the fact that the upper momentum indicator has reached the green oversold zone, there is no indication that this correction is over. There is no deceleration showing in the index or in the indicators.
The pull-back may find some support on the converging trend lines, which also correspond to the level of the 50-DMA. The chart pattern still looks more like a correction than the beginning of a serious downtrend. However, if the dollar (78.93) does not stop at 79 on the P&F chart, it will risk pulling back all the way down to 77 before reversing
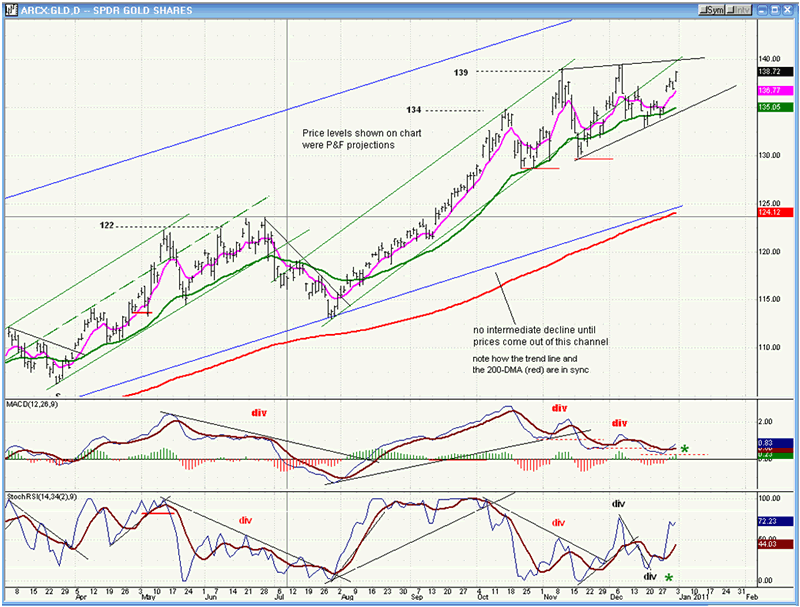
Gold
The price of gold has benefited from the correction in the dollar. The pattern that GLD is making is unclear, but will probably turn out to be an ending diagonal if the dollar finds support and starts to rally. The last few upticks have been on very light volume.
The other possibility is that the ETF is preparing to extend its move to 151-152 if the dollar shows continued weakness -- perhaps even to 157.
Summary
With short-term cycles due to bottom over the next few days, the SPX is likely to have formed a short-term top at 1162.60. Declining prices should begin to find support at about 1147, but there has been enough distribution to send the index down to about 1142.
After this minor correction is completed, the SPX could either attempt to reach the next higher projection of 1175, or it could simply expand its topping pattern in preparation for a more serious decline.
The dollar -- which continues to have an inverse relationship with equity indices - could be a major influence on what happens after the correction is over.
I want to extend to everyone my best wishes for the New Year!
FREE TRIAL SUBSCRIPTON
If precision in market timing is something which is important to you, you should consider a trial subscription to my service. It is free, and you will have four weeks to evaluate the claims made by the following subscribers:
Thanks for all your help. You have done a superb job in what is obviously a difficult market to gauge. J.D.
Unbelievable call. U nailed it, and never backed off. C.S.
I hope you can teach me about the market and the cycles. I want to be like you and be the best at it. F.J.
But don't take their word for it! Find out for yourself with a FREE 4-week trial. Send an email to ajg@cybertrails.com .
By Andre Gratian
MarketTurningPoints.com
A market advisory service should be evaluated on the basis of its forecasting accuracy and cost. At $25.00 per month, this service is probably the best all-around value. Two areas of analysis that are unmatched anywhere else -- cycles (from 2.5-wk to 18-years and longer) and accurate, coordinated Point & Figure and Fibonacci projections -- are combined with other methodologies to bring you weekly reports and frequent daily updates.
“By the Law of Periodical Repetition, everything which has happened once must happen again, and again, and again -- and not capriciously, but at regular periods, and each thing in its own period, not another’s, and each obeying its own law … The same Nature which delights in periodical repetition in the sky is the Nature which orders the affairs of the earth. Let us not underrate the value of that hint.” -- Mark Twain
You may also want to visit the Market Turning Points website to familiarize yourself with my philosophy and strategy.www.marketurningpoints.com
Disclaimer - The above comments about the financial markets are based purely on what I consider to be sound technical analysis principles uncompromised by fundamental considerations. They represent my own opinion and are not meant to be construed as trading or investment advice, but are offered as an analytical point of view which might be of interest to those who follow stock market cycles and technical analysis.
Andre Gratian Archive |
© 2005-2022 http://www.MarketOracle.co.uk - The Market Oracle is a FREE Daily Financial Markets Analysis & Forecasting online publication.