


Stock Market Train Crash 2011, Continued
Stock-Markets / Stocks Bear Market Jan 27, 2011 - 05:26 AM GMTBy: Brian_Bloom

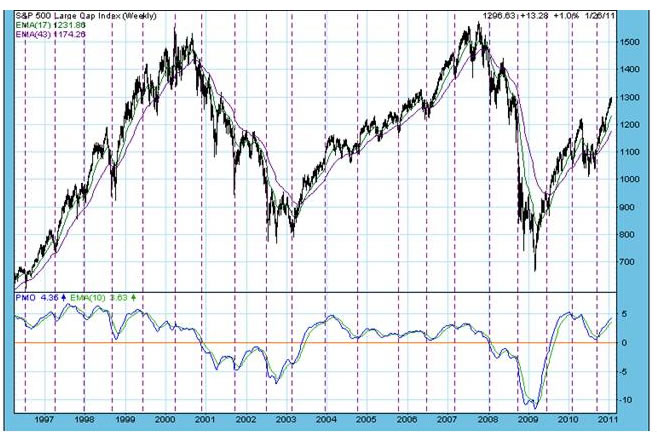
 Below are two charts showing the cyclical behaviour of the S&P 500 – over a +-9 month cycle and a +-4 year cycle. (source: DecisionPoint.com)
Essentially, the way cycles are measured on a computer is that the computer looks for dips or valley bottoms and then looks to see whether there is any periodicity to those dips. 9 months and 48 months appear to be recurring periods of valleys. It is never “precisely” the same – but always +- a similar amount. That’s why the perpendicular dashed lines are not always equidistant.
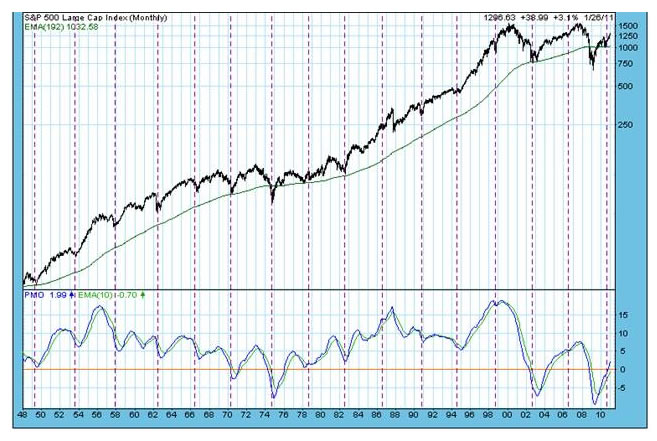
In a Bull market, the valleys of the index at the culmination of any particular cycle occur at successively higher levels. In a Bear market they occur at successively lower levels. The following are four examples in the 4 year cycle analysis chart above:
1. The valley in the beginning of in 1998/9 was higher than the valley in 1994/5
2. Then, in 2002, the next valley was lower than the previous low in 1998/9 –a confirmation that a Primary Bear Market had commenced.
3. At the end of the next 4 year cycle (2002/3-2006/7) , the “peak” of the cycle coincided with the valley and that peak was lower than the 1998/9 – 2002/3 peak. (Confirming that a new “bull Market” had not commenced)
4. In the next four year cycle – 2006/7 – 2010/11, the “valley” was once again lower than the immediately preceding valley – confirming that we are still in the clutches of a Primary Bear Market
Readers should be aware that a Primary move typically has three Primary legs.
1. Visionaries Buy/Sell Out (depending on the Primary Direction) (Intuitive)
2. Professionals buy/sell out (Logical)
3. The public buys/sells out (emotional)
The reader’s attention is drawn to the fact that in the current Primary Bear Market we have only had two Primary Down legs – from 2000 – 2002/3 and from 2007 – 2008/9
Interim conclusion
WE STILL HAVE ONE MORE DOWN LEG TO COME – THE EMOTIONAL ONE – WHERE PRICES ARE DRIVEN BY PANIC SELLING BY THE PUBLIC
Attention is now drawn to the first chart above. It can be seen that the most recent valley occurred around September 2010 (Visually. I have not checked the detail. My interest is in the principle). We are therefore around 3 – 4 months into the next 9 month cycle.
Now have a look at the PMO in the previous 9 month cycle. It was around the same time in the cycle that a non confirmation arose – whereby the index went to a higher high but the PMO showed descending tops. Soon thereafter, the market came back savagely – by around 15%.
From the valley at the end of that fall, the market bounced strongly but the most recent valley was lower than the one preceding it – thereby confirming once again that we are in a Primary Bear Market
The fact that the PMO is currently below the high of the previous move is, to my way of thinking, very ominous. If we are in a Primary Bear Market – which theory says we are because we have not yet a third and final washout Primary down move – then the next cycle should end well below the valley of the last cycle – which was at around 1100. Thereafter, valleys should end at successive lows as the public heard begins to stampede and until the sellers are exhausted. The next valley should manifest before June 2011.
Now let’s have a look at two other “confirmations” that the Bear Market is not yet over:
1. Note from the chart below that the Baltic Dry Goods Index has fallen to a new low of 1292. Yes, the Australian Floods have interrupted deliveries of coal, sugar and wheat. So what? Lost turnover is lost turnover. It cannot be recovered. Profits (of those who relied on receiving those dry goods) are going to be negatively impacted.
2. The “non confirmation” of Dow Transportation Average and the Dow Industrial Index is a Dow Theory Warning sign that all is not well. The Dow Transportation index is doing what the Baltic Dry Goods Index is saying it should do, and the Industrial Index is not.
Rather than show the conventional charts, I am choosing to show the ratio (relative strength) chart in Point & Figure Format (courtesy stockcharts.com)
Note how the ratio is still above the rising blue line but that it is at 42.6. If that ratio should fall to 39.3 then we might well experience a repeat of what happened in September 2008 – when the markets hit the wall
The question we have to ask ourselves is: Given the annual interest burden on $14 trillion public debt and given the high level of unemployment and given the fact that – based on state of the Case Schiller Index - the domestic real estate market in the USA is probably heading for a double dip (see: http://www.thenewamerican.com/index.php/economy/commentary-mainmenu-43/6049-housing-double-dip-is-here-case-shiller ); what is going to “drive” the US economy higher? Well, let’s put it this way. Soothing words from President Obama are not going to put bread on the tables of the unemployed.
Conclusion
CONDITIONS CONTINUE TO BUILD FOR A TRAIN SMASH
Analyst comment:
It is intriguing to me that several of the websites who for years used to publish my personal introspections (for that is what these analyses are) are recently choosing not to publish. Perhaps it’s because these article s have become a tad more superficial since I became more deeply involved in writing my second novel, The Last Finesse. Perhaps it’s because I am not prepared to memorise each website’s rules for publication of that for which I am receiving no payment. Perhaps they reason that my stubborn bearishness is a sign that I am arguing with the market. Well, the fact is that I am not arguing with the market – as the above clearly demonstrates. The market is screaming at me that things are not as they seem at first glance.
There will be many technical analysts who will be seeing bullishness in the current markets. No one can argue that they are wrong. But what can certainly be argued is that the bullishness needs to be seen in context. A 1.8% dividend yield on the S&P 500 is anything other than bullish. What has been “driving” the markets is a tidal wave of money. Even tidal waves calm down eventually. In this case, with a Public Debt level of$14 trillion and a Congress that is turning feral, the wriggle room for the Fed to continue flooding the markets with liquidity is becoming severely constrained. The tea leaves are showing either deflation or hyperinflation. I choose to proceed from the assumption that our financial authorities are not stupid. They will not deliberately push the entire world economy over the edge of hyperinflation in a dollar denominated world. Therefore, it seems more reasonable to me that deflation will win.
Because these missives are nothing other than personal introspections – which I have chosen to use as a marketing tool for my books – I don’t particularly care one way or another whether these articles are published. I am not a professional market analyst. The articles act as an external discipline for me to think things through properly. I am choosing to share my thoughts. Hopefully some will see that as constructive in a world that has become too self-centred. And, of course, my conclusions might be wrong.
By Brian Bloom
Once in a while a book comes along that ‘nails’ the issues of our times. Brian Bloom has demonstrated an uncanny ability to predict world events, sometimes even before they are on the media radar. First he predicted the world financial crisis and its timing, then the increasing controversies regarding the causes of climate change. Next will be a dawning understanding that humanity must embrace radically new thought paradigms with regard to energy, or face extinction.
Via the medium of its lighthearted and entertaining storyline, Beyond Neanderthal highlights the common links between Christianity, Judaism, Islam, Hinduism and Taoism and draws attention to an alternative energy source known to the Ancients. How was this common knowledge lost? Have ego and testosterone befuddled our thought processes? The Muslim population is now approaching 1.6 billion across the planet. The clash of civilizations between Judeo-Christians and Muslims is heightening. Is there a peaceful way to diffuse this situation or will ego and testosterone get in the way of that too? Beyond Neanderthal makes the case for a possible way forward on both the energy and the clash of civilizations fronts.
Copies of Beyond Neanderthal may be ordered via www.beyondneanderthal.com or from Amazon
Copyright © 2011 Brian Bloom - All Rights Reserved
Disclaimer: The above is a matter of opinion provided for general information purposes only and is not intended as investment advice. Information and analysis above are derived from sources and utilising methods believed to be reliable, but we cannot accept responsibility for any losses you may incur as a result of this analysis. Individuals should consult with their personal financial advisors.
Brian Bloom Archive |
© 2005-2022 http://www.MarketOracle.co.uk - The Market Oracle is a FREE Daily Financial Markets Analysis & Forecasting online publication.
Comments
|
bpb
27 Jan 11, 20:46 |
train crash
I am not sure it is a train crash but it is a rough track for sure. |