


Stocks, Gold and Oil Markets Weekend Report
Stock-Markets / Financial Markets 2011 Mar 20, 2011 - 10:17 PM GMTBy: Andre_Gratian

 Overview
On Friday, the indices had an opportunity to demonstrate that they had ended their correction and had reversed. They failed to do so. The SPX could not break out of its secondary channel, and the lack of readiness was particularly evident in the QQQQ.
This leaves the market two choices: further base-building consolidation, or resuming its decline. Because of the position of the hourly indicators it is not likely that the indices will try to extend the near-term uptrend right away. They are overbought, are beginning to roll over, and my early bird oscillator has already given a preliminary sell signal. Based on this observation, Monday could be a down-day, but by how much remains to be seen.
Could we make new lows? We discussed earlier that the SPX has a valid count to about 1240 and, based on its P&F chart I could make a case for the QQQQ to reach 52.50-53.00 before ending its decline. If these objectives are reached, it would put both indices outside their intermediate channel.
Still, I have reasons to think that this decline will be of limited extent and duration. This is, in part, based on the current position of the SentimenTrader which is shown below on the left (courtesy of same), and which is very bullish.
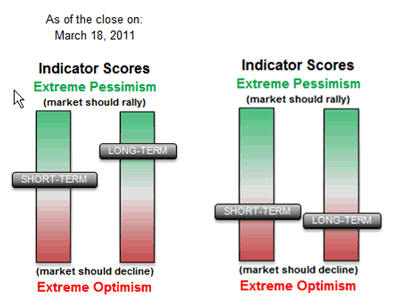
The longer I follow this indicator, the more I trust it. The SentimenTrader graph on the right represents its position one week before the market top, and it had essentially the same readings at the top. I have observed that major tops begin when this indicator's long-term reading is far more bearish, almost all the way down to the bottom of the bar. Based on this observation, I would deduce that the recent top is not a major one. And because of its current position, I believe it is signaling that we are very close to a market low. Any further decline from here would most likely make it even more bullish!
Let's look at some charts. First, we'll analyze the portion of the Daily SPX Chart that concerns us.
This is the second correction which has occurred in the uptrend which started at 1041. Since it comes at a higher level, it is befitting that it should be more important than the first, which lasted only about three weeks and ended on 11/30. The current five-week long decline has found some support at the bottom of the blue intermediate channel, but there is a valid Point & Figure target of about 1240 which is supported by a Fibonacci projection to 1243. Should the SPX reach that level, it would put the low outside the intermediate channel.
Would this be significant and indicate that we are facing a much longer decline? Probably not! In any trend, trend lines and channels are continually being readjusted as deceleration takes place and until the final top is reached. As stated earlier, there are some good reasons to think that this is not the end of the trend which started at 1041.
If we compare the current indicator profile to that of the November decline, we see that the two lower indicators, thus far, look very similar to the November ones. They both reached the same oversold levels and bounced up from their lows. In November, that first bounce was an indication that the low had been made. It was subsequently re-tested over the next few days, after which the uptrend resumed. And unless last Wednesday was a climactic bottom, I think that we may, at this time, do something similar. Whether or not we go slightly lower over the next few days before finding the bottom and resuming the uptrend is immaterial. When it's all said and done, the two patterns could end up looking very much the same.
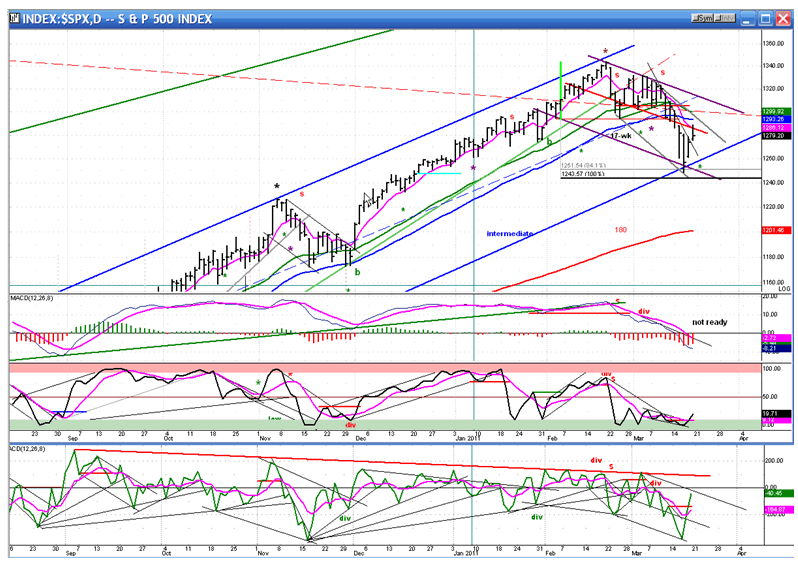
On Friday, I mentioned that in just three days, the Point & Figure chart had already formed a base pattern which measured one hundred points across. Any retracement or further downside action would modify that pattern and possibly extend the count.
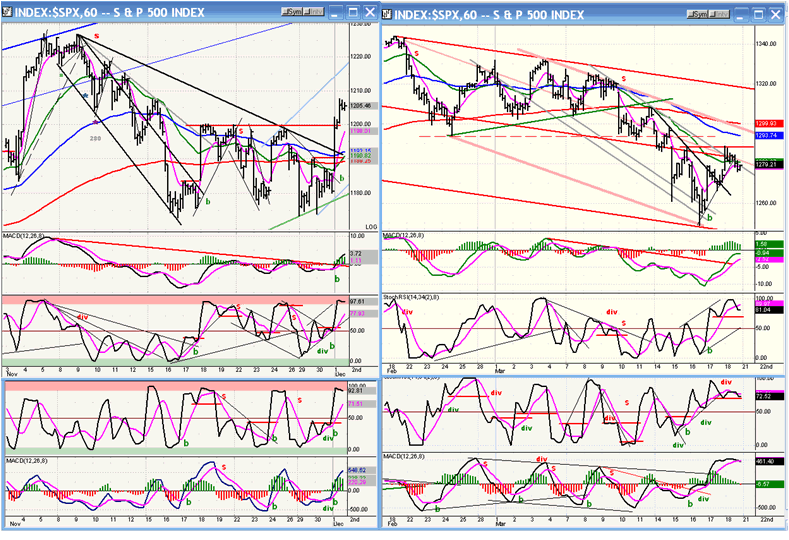
Now, let's look at the Hourly Chart.
I have placed the chart of the November decline on the left and the current decline on the right to see if, when looking at the former correction, we can obtain some hints about what we are doing today. We've already acknowledged that we are in the midst of a deeper and longer correction than the previous one. The similarity of the two patterns will end if the move of the last two days follows through and confirms that the drop to 1250 has been a climactic low in the form of a small Head & Shoulders reversal. If we go on to make essentially the same pattern as the previous correction, there will be some additional backing and filling in a test of the low, perhaps the making of a new low at about 1240.
As of Friday, the indicators may be in the same position as they were on November 18 when the test of the November low began. If so, it will take at least one or two high to low cycles in the hourly indicators before we are ready to resume the uptrend.
This is speculation, of course, but patterns do tend to repeat themselves and, since we know that the daily indicators may require one or two cycles of the hourly indicators to get into a better position for a buy signal, we may end up with something which resembles what took place in November. When positive divergence starts to show in the hourly indicators it may be time to look for a reversal of the trend, especially if the daily indicators are also showing positive divergence.
The Dollar
On Friday, the dollar reached 76 and could still drop another point to 75 before finding support.
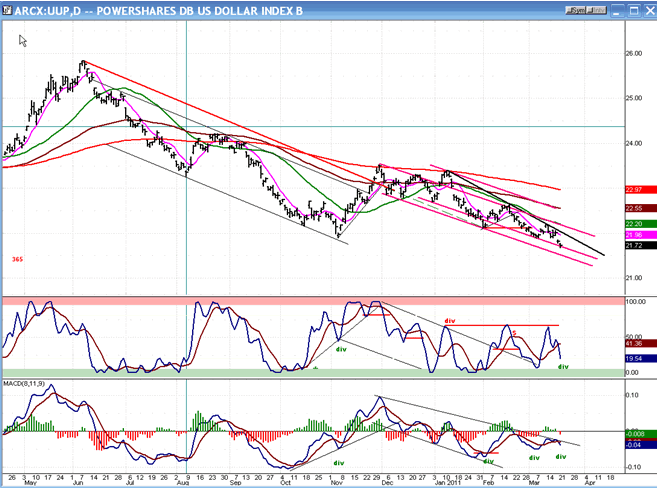
However, the chart of the dollar ETF (UUP) shows that it has come to rest on an internal channel line, making a 5-wave wedge pattern and showing positive divergence in its indicators. These are all potentially bullish signs which could lead to a reversal.
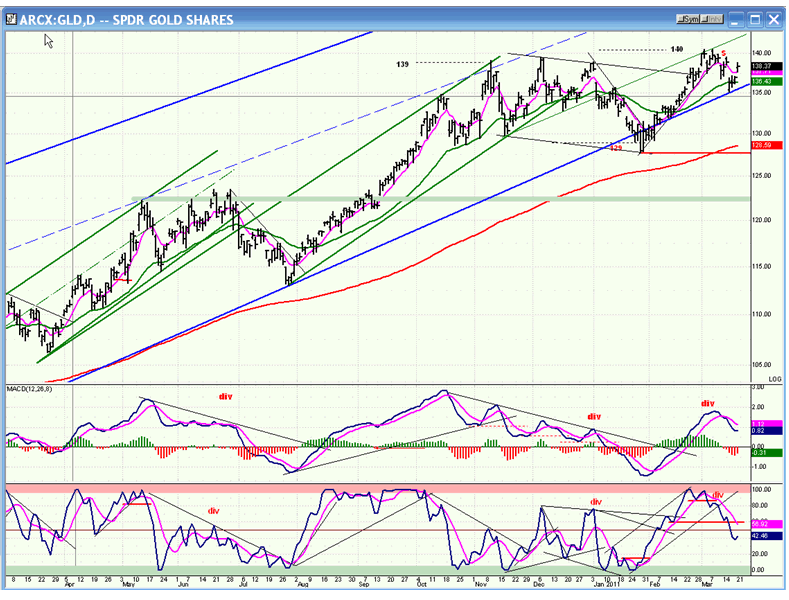
Gold
GLD is still undecided about whether it wants to push forward or continue to correct. The rally which followed the initial pull-back has stopped at its 140 P&F target and started to retrace once again; but found support on its long-term log trend line. The fact that this trend line was violated earlier heightens the odds that it will eventually and decisively give way -- which will result in a larger correction.
Since last November, the index has been in a broad but incomplete sideways consolidation which could result in some additional downside action. The daily indicators were showing some negative divergence at the top and have, since then, turned down. The weekly indicators are far more negative which is the reason why the current consolidation could easily result in an intermediate correction.
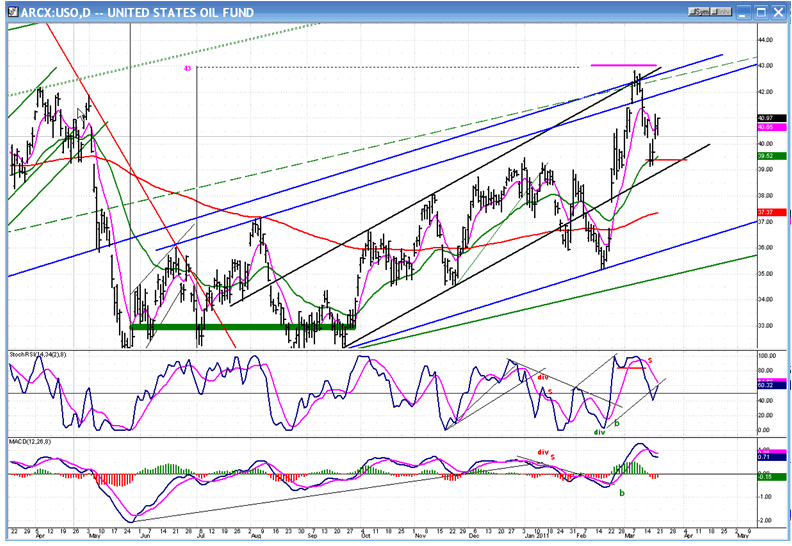
Oil
USO in particular, and all oil indices in general, have paused in their uptrends in accordance with the predictions that were made two weeks ago based on their Point & Figure chart patterns, and they are now consolidating their gains. This consolidation does not look complete, but the downside risk appears to be very limited at this time.
USO found good support exactly where it should have -- at a former rally peak -- and bounced, but it could re-test that area. The indicators do not show that they are ready to support a resumption of the uptrend, and more consolidation/correction appears to be needed. Since there are higher projections (USO 46), this is likely to be only a temporary pause in the uptrend.
FREE TRIAL SUBSCRIPTON
If precision in market timing for all time frames is something which is important to you, you should consider a trial subscription to my service. It is free, and you will have four weeks to evaluate its worth.
For a FREE 4-week trial. Send an email to: ajg@cybertrails.com
For further subscription options, payment plans, and for important general information, I encourage you to visit my website at www.marketurningpoints.com. It contains summaries of my background, my investment and trading strategies and my unique method of intra-day communication with Market Turning Points subscribers.
By Andre Gratian
MarketTurningPoints.com
A market advisory service should be evaluated on the basis of its forecasting accuracy and cost. At $25.00 per month, this service is probably the best all-around value. Two areas of analysis that are unmatched anywhere else -- cycles (from 2.5-wk to 18-years and longer) and accurate, coordinated Point & Figure and Fibonacci projections -- are combined with other methodologies to bring you weekly reports and frequent daily updates.
“By the Law of Periodical Repetition, everything which has happened once must happen again, and again, and again -- and not capriciously, but at regular periods, and each thing in its own period, not another’s, and each obeying its own law … The same Nature which delights in periodical repetition in the sky is the Nature which orders the affairs of the earth. Let us not underrate the value of that hint.” -- Mark Twain
You may also want to visit the Market Turning Points website to familiarize yourself with my philosophy and strategy.www.marketurningpoints.com
Disclaimer - The above comments about the financial markets are based purely on what I consider to be sound technical analysis principles uncompromised by fundamental considerations. They represent my own opinion and are not meant to be construed as trading or investment advice, but are offered as an analytical point of view which might be of interest to those who follow stock market cycles and technical analysis.
Andre Gratian Archive |
© 2005-2022 http://www.MarketOracle.co.uk - The Market Oracle is a FREE Daily Financial Markets Analysis & Forecasting online publication.