


Stocks Stealth Bull Market and Elliott Wave Theory Analysis
Stock-Markets / Elliott Wave Theory Mar 30, 2011 - 03:42 AM GMTBy: Nadeem_Walayat

 My unorthodox interpretation of Elliott Wave Theory has proved highly accurate for the duration of the stocks stealth bull market from its birth in March 2009 in gauging the probable trend for the Dow for the past 2 years, in that there are no hard and fast rules, no tenants, no absolutes that the price must obey as per theory, because in the real world the price action is the master not theoretically what the price action should do which is why over zealot proponents of elliott wave theory have missed the whole stocks bull market, instead of which the theory is just that, a theory, so should bend or even break in the face of real time price action and not engage in the exercise of ever expanding hindsight based pattern fixing.
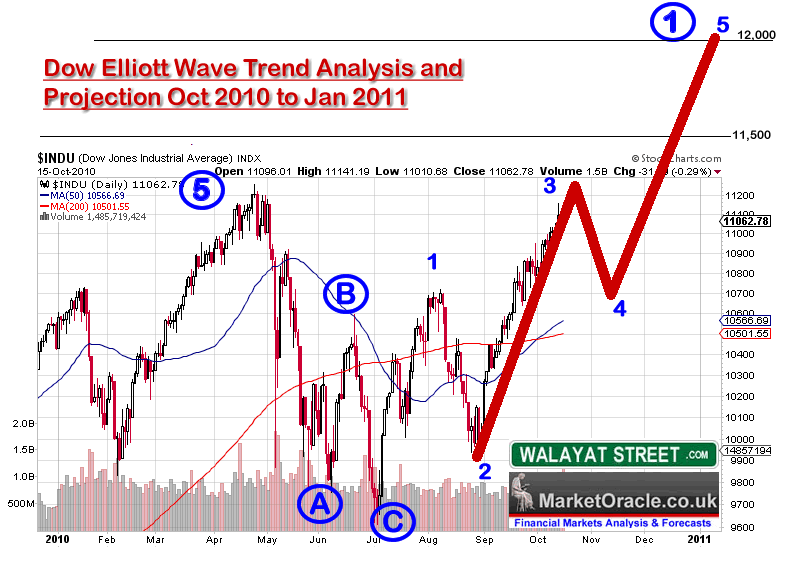
My last in depth analysis (18 Oct 2010 - Stocks Stealth Bull Market Dow Trend Forecast into Jan 2011) concluded that the stock market was about to complete a 3rd wave high to be followed by a wave 4 correction before a wave 5 rally to Dow 12000 during January 2011 as illustrated by the below original chart.
Subsequent price action showed that elliott waves played an important part in arriving at an accurate final trend forecast conclusion.
Elliott Wave Price & Time Analysis
Carrying over the wave pattern conclusion from the last analysis of October 2010, which implied that the forecast 5th wave peak would resolve in a significant correction of approx 10% that sought to correct the whole move from the July 2010 low that has subsequently come to pass.
Current EW Analysis -
- The 5 Wave advance from July 2010 to Feb 2011 took 7 months.
- The subsequent abc correction has taken less than 1 month, the preceding abc took 2.5 months. This indicates that the current correction if over is minor in nature which is inline with the wave pattern that Feb high was a minor wave high than that which terminated in April 2010 i.e. Major Wave 1 against Major Wave 5 in April 2010.
- The run up to the Feb 2011 peak had Waves 3 and 5 of comparable length in price and time and wave 1 was the shortest, law of alternating trends suggests that the next wave 1 should be longer and either wave 3 or 5 the shortest.
On face value the above EWT analysis resolves in the correction being over and that the stock market has now entered into a strong bull run to form a powerful Wave 1 rally that could last another 2 months or so.
The problem is that this resolution in EWT price pattern is too neat and tidy, rather too obvious, which suggests to me that the probability of it transpiring is less than 50%.
So how would the bears interpret the EWT price action ?
Obviously that every market high is the final fifth, this would imply that the major wave 5 was instead an A and major C was wave B and Major 1 is a C so once more terminating the so called bear market rally much as the April 2010 high was end of the bear market rally as was virtually every prior peak.
Will the stock market be devious and give the bears some more rope to hang themselves with as well as put doubt into the bulls minds ?
Such price action would be suggestive of a trading range which both fails to break higher and break lower, thus each time the Dow trades near the extremes of the trading range then it will accumulate more bull and bearish positions as each become more vocal in the certainty of the outcome at the extremes and thus preparing the way for a powerful breakout. Off course since we are in a stocks stealth bull market probability favours the breakout direction to be to the upside.
The question mark is what kind of price pattern could generate such a trend ?
That of a sideways volatile trading range before a breakout higher, to be blunt it's not important because it will only become clear in HINDSIGHT, when many analysts will use their rear view mirrors once more to have seen it all along with crystal clarity regardless of the actual facts.
Elliott Wave Conclusion
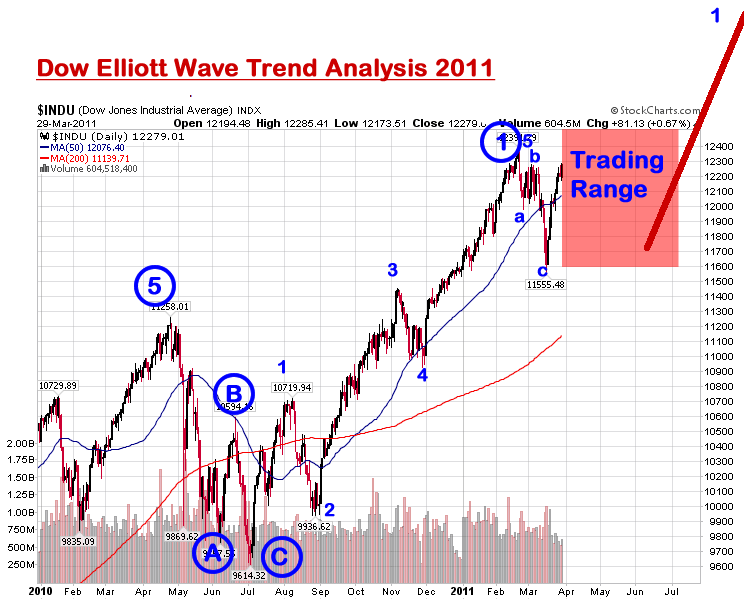
My interpretation of EWT suggests that the correction is going to morph into a trading range with an upward bias as the stock market attempts to break higher and thus there will be likely plenty of ziga ziga ah-ing Spice Girls style along the highs over the coming months to confuse the absolutists wave counts of both bulls and bears that will only become clear in hindsight. The overall trend of a trading range (with false upside breakouts more probable than downside breaks) that at least extends into Mid May and possibly all the way into July could look rather messy and be full of nasty whipsaws that would punish both the bulls and bears before the stock market sustains a breakout higher. The only question mark is when will the stock market break higher which my ongoing in-depth analysis will seek to resolve towards a final trend conclusion for the remainder of 2011 which this EWT analysis forms a mere part of.
However it cannot be denied that the current rally is strong and impulsive in nature so the alternative is that this time EWT will work like clock work and generate an far easier pattern for the bulls at least to interpret and act upon which suggests a strong bull run into Mid May to well beyond the last bull market high of 12,391, that will once more leave the perma-bears end of the bull market calls busted once more, before the stock market enters into a summer correction (Sell in May and Go Away).
Bottom line - There is nothing in EWT to suggest that the 2 year bull market is ending, if anything EWT implies stocks have another year of gains ahead of them. Immediate future is less certain, and leads me towards a volatile trading range with an upward bias into at least mid May and as late as early July in advance of sustained bull run out of the range. So perma-EWT bears can be expected to suffer from another year of amnesia as they scramble to re-invent another year of busted bear market calls.
The Dangers of Being Seduced by Elliott Wave Theory
Now, despite my interpretation of Elliot Wave analysis having proved highly accurate both before and since the March 2009 low and the above also very convincing on where the Dow could trend during 2011. However, before you start thinking that EWT maybe the 'holy grail' of analysis, take note that EWT Analysis on its own is just ONE component, and therefore one should not let oneself become seduced by what is highly seductive in the ease to which multiple junctures can be extended into the far distant future, which is how the highly public self professed Elliott Wave Gurus like it to be seen to be, though many of whom have apparently missed THE WHOLE STOCKS BULL MARKET as they continue to call one of the greatest bull markets in history a Bear Market rally and thus suffer from a case of permanent amnesia! which should send anyone's alarm bells ringing! Therefore Elliott Wave Theory, whilst continuing to strongly imply a bull run is expected to continue into end of 2011, however on it's own, in the long-run it is NOT going to be more accurate than a coin toss! The conclusions no matter how convincing of ANY single Component tool NEED to be confirmed by other fundamental and Technical analysis so as to arrive at a probable final conclusion rather than that which is perpetuated by EWT fanatics that have long since left reality behind them as evidenced by the fact that they still put their names to the worthless banner of a stocks "Bear Market Rally" that is anything but, under any rational measure.
Therefore despite EWT being a useful tool, I am ALWAYS on guard against being seduced by EWT as it is extremely easy to back fit onto what has already happened to imply something highly probable is about to take place when the complete opposite may be true. So yes, whilst it's implications can get the adrenaline pumping and one eager to hit the TRADE button! I do have to take deep breaths and remember that there are NO short cuts! NO matter how enticing it appears, on its own EWT in the long-run WILL NOT be more accurate than COIN TOSS !
So, always keep in your mind that the EWT component Equates to a Coin Toss Over the Long-run and you won't become seduced and end up missing whole bull markets as MANY so called MASTER ELLIOTTITIONS have proceed to do ! Because they believe their own hype, much as gannophiles have been seduced by the master price time squares that is yet again another example of coin flip analysis elevated to 'holy grail' high priesthood status so as to perpetuate myths along the same lines that religious myths of so called revelations are perpetuated to fit in hindsight any subsequent event! When in reality EWT's true purpose should be to skew ones perception of the price action thus enabling an unbiased and always skeptical analysts to interpret price action from another perspective as part of a broader whole, even this will not guarantee success because analysis and trading boils down to probabilities and NOT certainties of outcome.
Stock Market Trend Forecast for 2011.
This analysis forms part of a series that is working towards a detailed trend forecast graph for the stocks stealth bull market for the remainder of 2011. Ensure you are subscribed to my always free newsletter to get this in your email in box which I hope to complete as early as by tomorrow evening (31st March 2011), including a comprehensive ebook in a further few days time.
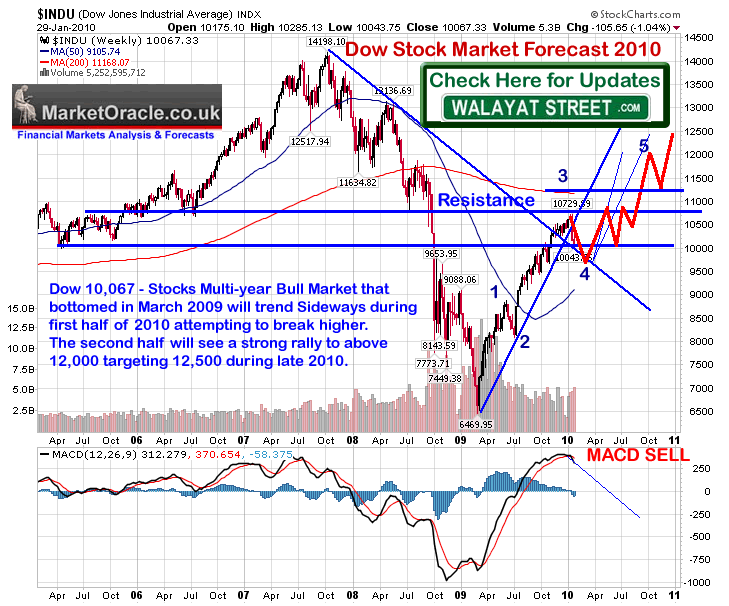
Recap of Stock Market Trend Forecast for 2010 - 02 Feb 2010 - Stocks Stealth Bull Market Trend Forecast For 2010
Dow 10,067 - Stocks Multi-year Bull Market that bottomed in March 2009 will trend Sideways during first half of 2010 attempting to break higher. The second half will see a strong rally to above 12,000 targeting 12,500 during late 2010.
Your unbiased stock index trading analyst.
Source and Comments: http://www.marketoracle.co.uk/Article27246.html
By Nadeem Walayat
Copyright © 2005-2011 Marketoracle.co.uk (Market Oracle Ltd). All rights reserved.
 Nadeem Walayat has over 25 years experience of trading derivatives, portfolio management and analysing the financial markets, including one of few who both anticipated and Beat the 1987 Crash. Nadeem's forward looking analysis focuses on UK inflation, economy, interest rates and housing market. He is the author of two ebook's - The Inflation Mega-Trend(Jan 2010) and The Interest Rate Mega-Trend(Mar 2011) that can be downloaded for Free. Nadeem is the Editor of The Market Oracle, a FREE Daily Financial Markets Analysis & Forecasting online publication that presents in-depth analysis from over 600 experienced analysts on a range of views of the probable direction of the financial markets, thus enabling our readers to arrive at an informed opinion on future market direction. http://www.marketoracle.co.uk
Disclaimer: The above is a matter of opinion provided for general information purposes only and is not intended as investment advice. Information and analysis above are derived from sources and utilising methods believed to be reliable, but we cannot accept responsibility for any trading losses you may incur as a result of this analysis. Individuals should consult with their personal financial advisors before engaging in any trading activities.
Nadeem Walayat Archive |
© 2005-2022 http://www.MarketOracle.co.uk - The Market Oracle is a FREE Daily Financial Markets Analysis & Forecasting online publication.