


Gold Long-term Long Way From a Bearish Reversal
Commodities / Gold and Silver 2011 May 08, 2011 - 03:32 AM GMTBy: Merv_Burak

 Darn, missed it by $2.40. My long term projection of $1575 was exceeded by $2.40. Oh well, better luck next time. Now what? There was a lot of damage done this past week and it may take time to fully recover. However, anyone who thinks that the US $ is still not in deep trouble reflecting in higher gold prices sometimes ahead is not looking at things realistically.
GOLD
LONG TERM
The long term P&F chart is no help here in trying to guess what next for gold price. It is still a long way from a bearish reversal and really requires a couple of direction reversals to give any reasonable message. For now it is still bullish although dropping drastically, as could be expected.
Despite the plunge during the week my long term indicators are still in comfortable positive territory and nowhere near giving a reversal signal. The week’s collapse in gold price is so far more of an intermediate and short term problem and only an annoyance from the long term perspective.
Gold closed Friday on the up side but nowhere near recovering. However, it is still above its positive sloping moving average line. The long term momentum indicator is still comfortably above its neutral line in the positive zone. However, the one minor negative is the indicator being below its negative sloping trigger line. The volume indicator is still in a positive trend from the long term perspective and remains above its positive trigger line. For now the long term rating remains BULLISH.
INTERMEDIATE TERM
All is not yet lost. The intermediate term remained positive during the plunge with the gold price just touching the positive sloping intermediate term moving average line on Thursday resulting in that mild bounce on Friday. The intermediate term momentum indicator remained in its positive zone although it did go through quite a drop and ended the week below its negative trigger line. As for the volume indicator, it is still trending positively and closed the week slightly above its positive trigger line. So, all in all, the intermediate term rating remains BULLISH. The short term moving average line is still some distance above the intermediate term line confirming this bull.
SHORT TERM
Well that was quick. No sooner were the FAN lines shown last week than that blow-off third FAN trend line was broken and the plunge was upon us. If one looks closely there were a couple of warnings the day or so before the plunge. The gold price made new highs on Monday BUT closed below its opening price suggesting some exhaustion in the move.
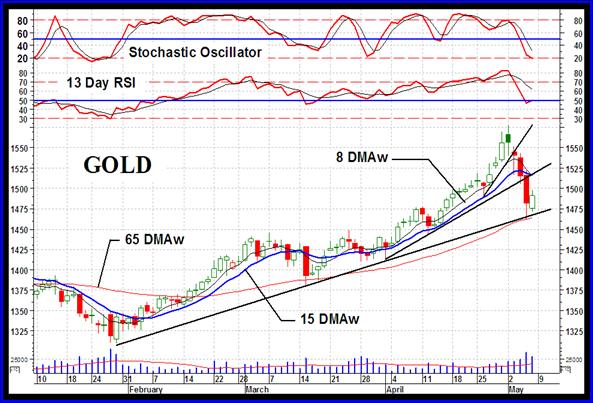
The Stochastic Oscillator was anemic and just couldn’t match the new high in gold price suggesting here a serious weakness in the move. The next day gold closed below the third FAN trend line and that was it. Very quickly the plunge reached that first FAN trend line and Friday we had a little bounce. Now what? I would not be surprised if gold remained trading in that area between the first and second FAN trend lines for a while, but who knows? From here anything can happen. I would not be too inclined to guess a quick recovery until the stocks perk up. As often suggested here, the stocks are very often a leading indicator to what might be expected from the commodity. So we watch both, just in case the stocks do not give us that advance notice.
As for where we are from the short term perspective, well, gold is trading below its negative short term moving average line. The momentum indicator was in its negative zone but closed on Friday just a hair above its neutral line. It remains below its negative trigger line. As for the daily volume activity, that has been mostly on the down side this past week. All in all the short term rating, at the Friday close, is BEARISH. The very short term moving average line has just confirmed that rating by closing on Friday just very slightly below the short term moving average line.
As for the immediate direction of least resistance, that is a difficult guess when one does not know what is happening on the world stage. The global politics have a great effect on the immediate direction of gold. I would think that the short term is still slanted towards the down side but we do have a couple of possible hints that a rally of some sort may not be long in coming. The Stochastic Oscillator has entered its oversold zone and a reversal could come any day although there is still no definite sign of one yet, just a hint of possible turning in its very early stage. The price itself perked up on Friday and may be headed towards that second FAN trend line, which might be considered as a resistance line now. I’ll go with the lateral as the best guess for the immediate direction although hoping for more upside.
SILVER
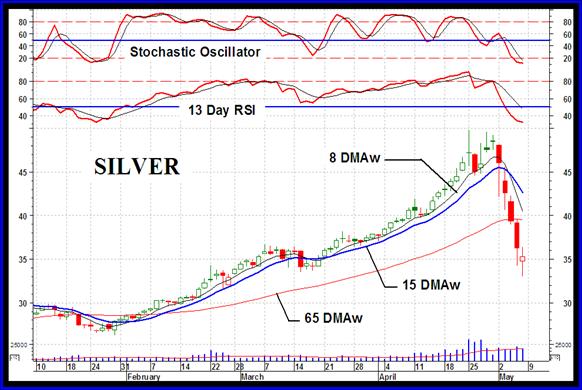
As one might expect with its recent superior performance, when the reaction came silver took a more severe beating than gold. We had all 5 days this past week of silver downside action. Friday’s action, however, closed above its opening price which might suggest that we might be in for a rally, even if of short term duration. As with gold the plunge in silver price has caused a great deal of damage and one should not expect an immediate recovery, they happen but don’t expect it. The Stochastic Oscillator is in its oversold zone and is starting to give us a hint that a turning process may be starting, so stay tuned. Watch the daily action on any of a variety of charting web sites if you are not downloading the daily data into your own computer.
While gold has just touched its intermediate term moving average line silver is far below its intermediate term line. In fact it is just slightly above its long term moving average line. I use a weighted moving average which is somewhat more aggressive than is the simple moving average. For those using the simple moving average line silver is still some distance above that long term line.
While the technical indicators are very much the same as for gold, the intermediate term ones are somewhat different. On the intermediate term silver is well below its negative moving average line. The momentum indicator has entered its negative zone and did not recover like gold on Friday. It remains below its negative trigger line. As one might expect the intermediate term volume indicator is coming down sharply and has ended the week just very slightly above its still positive trigger line. Putting it all together the intermediate term rating is now BEARISH. The other two time periods are similar to gold, BULLISH on the long term and BEARISH on the short term.
PRECIOUS METAL STOCKS
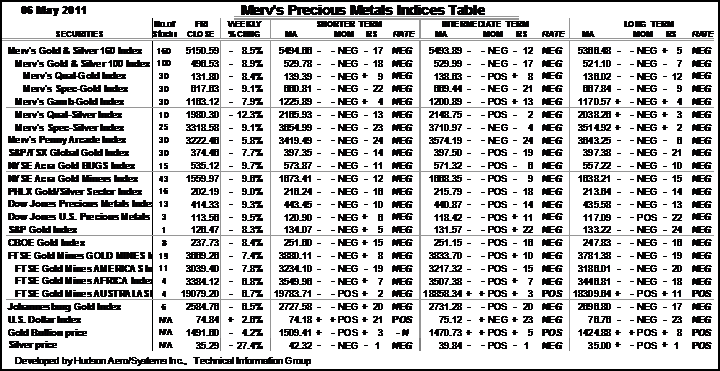
Well it sure looks like the Merv’s Penny Arcade Index was right. It started its decline several weeks back and was a warning of an upcoming reversal in the other Indices, which basically occurred this past week. Most of the North American Indices are sitting on top of support levels while the various Merv’s Indices (other than the Penny Arcade) are still some distance from their supports. The trend is, however, towards lower levels for a while. The action this past week took most stocks into negative territory. There were only 7% of the universe of 160 that closed the week on the up side. 93% of the universe stocks closed lower. That will take a little while to recover. Another way of looking at what occurred in the market is looking at how many stocks reversed their bullish rating to bearish ones. On the intermediate term a full 49 stocks reversed their rating. This is more than I ever recall seeing during a one week period. Let’s just say it will take some doing to recover from this past week, but I have no doubt that we will eventually recover and see new highs in the various Indices in the not too distant future. In the mean time there might still be more troubled waters ahead before the bottom.
Merv’s Precious Metals Indices Table
Well, that’s it for this week. Comments are always welcome and should be addressed to mervburak@gmail.com.
By Merv Burak, CMT
Hudson Aero/Systems Inc.
Technical Information Group
for Merv's Precious Metals Central
For DAILY Uranium stock commentary and WEEKLY Uranium market update check out my new Technically Uranium with Merv blog at http://techuranium.blogspot.com .
During the day Merv practices his engineering profession as a Consulting Aerospace Engineer. Once the sun goes down and night descends upon the earth Merv dons his other hat as a Chartered Market Technician ( CMT ) and tries to decipher what's going on in the securities markets. As an underground surveyor in the gold mines of Canada 's Northwest Territories in his youth, Merv has a soft spot for the gold industry and has developed several Gold Indices reflecting different aspects of the industry. As a basically lazy individual Merv's driving focus is to KEEP IT SIMPLE .
To find out more about Merv's various Gold Indices and component stocks, please visit http://preciousmetalscentral.com . There you will find samples of the Indices and their component stocks plus other publications of interest to gold investors.
Before you invest, Always check your market timing with a Qualified Professional Market Technician
Merv Burak Archive |
© 2005-2022 http://www.MarketOracle.co.uk - The Market Oracle is a FREE Daily Financial Markets Analysis & Forecasting online publication.