


Stock Market Closing in on a Low
Stock-Markets / Stock Markets 2011 Jun 13, 2011 - 04:40 AM GMTBy: Tony_Caldaro

 Another week, another decline. That’s six weeks in a row. Economic reports were not as negative as they have been in recent weeks. In fact 8 of the 10 reports came in positive. The two negatives were a slight uptick in weekly jobless claims and another decline in the WLEI. On the plus side: export/import prices and wholesale inventories remained positive; and the trade/budget deficits improved. Moving higher were consumer credit, the M1-multiplier and the monetary wbase. Most markets, with the exception of the USD, moved lower. The SPX/DOW lost 1.9%, and the NDX/NAZ dropped 3.2%. Asian markets lost 0.8%, European markets were -2.1%, the Commodity equity group were -0.8%, and the DJ World index lost 2.4%. Next week Retail sales, CPI/PPI and Options expiration.
LONG TERM: bull market
We have been counting this bull market as a Cycle wave [1] following a Supercycle SC 2 wave low at SPX 667 in March 2009. Since a Cycle wave consists of five Primary waves we have been counting this bull market as five primary waves with its subdivisions of Major, Intermediate waves, etc. The first two primary waves concluded in April 2010 at SPX 1220 and then July 2010 at SPX 1011. Primary three began at that low. Since Primary wave I divided into five distinct Major waves we expected Primary wave III to do the same. And thus far it has, with the possible exception of the recent activity.
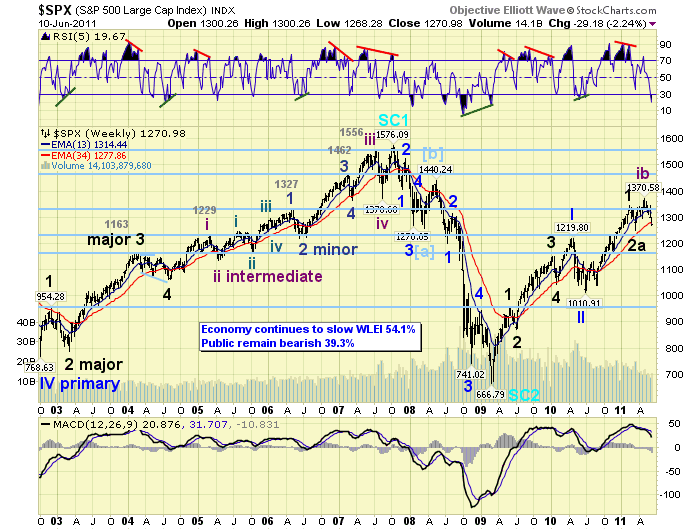
On a technical basis, once this correction concludes, we see very little reason for this bull market not to continue. The weekly RSI continues to display extreme overbought conditions and minor oversold. And, the weekly MACD remains well above neutral. Also, the NYAD made new highs recently with the new high in the market. We are still expecting this bull market to top near the all time high, SPX 1576, in 2012.
MEDIUM TERM: downtrend low SPX 1268
The SPX has been downtrending since the first trading day in May. Thus far, after six straight weeks of decline, the market has lost 7.5% of its value (SPX 1371 to 1268). This is quite normal for corrections during this bull market. Typically they reach about 9%, or around SPX 1248. On the weekly chart the RSI is already oversold. This suggest the correction is getting close to a bottom.
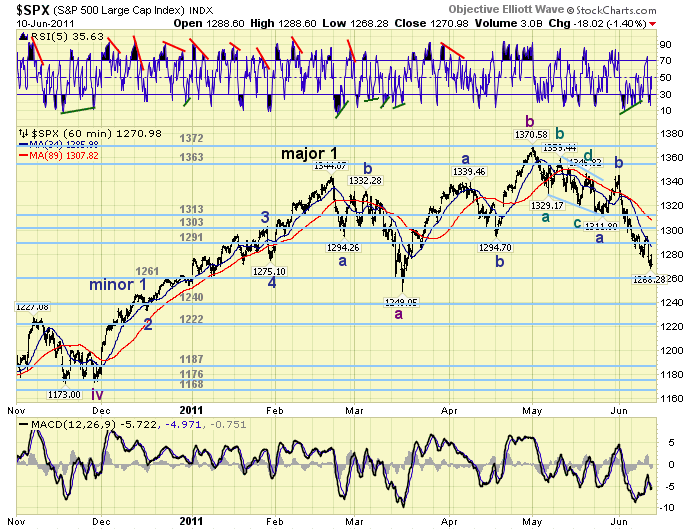
During the week we offered a count which suggests the entire activity from the Major wave 1 February high at SPX 1344 has been a corrective Major wave 2. The count offered is posted on the SPX hourly chart. This count suggests the Feb-Mar downtrend was Intermediate wave A of Major wave 2. The Mar-May uptrend was Intermediate wave B, and the current downtrend is Intermediate wave C. This pattern is an irregular complex three, taking the form of a possible flat should it conclude around SPX 1250. This would suggest the market has been consolidating before it enters Major wave 3. Normally, this is a quite bullish pattern. Less bullish patterns do not make new highs during the B wave portion of the correction. We also observe this pattern in many of the foreign markets we track, as well as some stocks.
For those more bearishly inclined. We offer two alternative SPX counts. One is posted on the NAZ daily suggesting this correction is part of Primary wave IV, with Primary wave III concluding at the SPX 1344 high. The other suggests the bull market ended at SPX 1371 with a completed five Primary waves up. These are two valid counts but currently have a lesser probability than the counts we have been tracking on the SPX charts.
SHORT TERM
Support for the SPX is at 1261 and then the 1240 pivots, with resistance at 1291 and the 1303 pivots. Short term momentum ended the week below neutral. The short term OEW charts have remained negative since SPX 1331.
The count we are tracking on the SPX hourly chart suggests the market has been in an irregular complex correction since February’s SPX 1344 high. The first downtrend Feb-Mar (SPX 1344-1249) took the form of a zigzag with wave C = 1.618 wave A. The recent uptrend Mar-May (SPX 1249-1371) also took the form of a zigzag. Now the current downtrend May-June (SPX 1371-1268) is taking the form of a zigzag as well. Should wave C equal 1.618 wave A, like the first downtrend, then this entire correction is likely to end soon within the OEW 1240 pivot range. Best to your trading!
FOREIGN MARKETS
Asian markets were mostly lower on the week for a net loss of 0.8%. All five indices we track remain in downtrends.
European markets were all lower on the week for a net loss of 2.1%. All five we track here are in downtrends as well.
The Commodity equity sector was mixed on the week for a net loss of 0.7%. All three indices we track are in downtrends, but Russia’s RTSI gained 3.8% on the week.
The DJ World index remains downtrending and lost 2.4% on the week.
COMMODITIES
Bond prices continue to uptrend but lost 0.8% on the week. The 10YR hit 2.92%. There are some divergences on the daily charts of both, suggesting a trend change may be next.
Crude continues to downtrend losing 0.9% on the week. Still expecting a downtrend low between $85 and $93.
Gold remains in an uptrend but lost 0.7% on the week. There is a negative divergence at this weeks high suggesting some caution heading into next week.
The USD remains in an uptrend gaining 2.0% on the week. It has been quite volatile on a week to week basis.
NEXT WEEK
A number of economic reports this options expiration week. On tuesday Retail sales, the PPI and Business inventories. On wednesday the CPI, NY FED, Industrial production, and the NAHB index. On thursday, weekly Jobless claims, Housing starts, Building permits, the Current account deficit and the Philly FED. Then on friday Consumer sentiment, Leading indicators and Options expiration. The FED is active this week as well. On tuesday a speech by FED chairman Bernanke in Wash, DC. On wednesday Senate testimony from FED directors Gibson and Foley. The next FOMC meeting is scheduled for June 21-22. Likely to be quite important for the markets. Best to your week!
CHARTS: http://stockcharts.com/...
http://caldaroew.spaces.live.com
After about 40 years of investing in the markets one learns that the markets are constantly changing, not only in price, but in what drives the markets. In the 1960s, the Nifty Fifty were the leaders of the stock market. In the 1970s, stock selection using Technical Analysis was important, as the market stayed with a trading range for the entire decade. In the 1980s, the market finally broke out of it doldrums, as the DOW broke through 1100 in 1982, and launched the greatest bull market on record.
Sharing is an important aspect of a life. Over 100 people have joined our group, from all walks of life, covering twenty three countries across the globe. It's been the most fun I have ever had in the market. Sharing uncommon knowledge, with investors. In hope of aiding them in finding their financial independence.
Copyright © 2011 Tony Caldaro - All Rights Reserved Disclaimer: The above is a matter of opinion provided for general information purposes only and is not intended as investment advice. Information and analysis above are derived from sources and utilising methods believed to be reliable, but we cannot accept responsibility for any losses you may incur as a result of this analysis. Individuals should consult with their personal financial advisors.
© 2005-2022 http://www.MarketOracle.co.uk - The Market Oracle is a FREE Daily Financial Markets Analysis & Forecasting online publication.