


European Debt Contagion Impact on Domestic Banks and Stock Market
Stock-Markets / Stock Markets 2011 Jun 16, 2011 - 10:38 AM GMTBy: J_W_Jones

 The price action in U.S. financial markets on Wednesday was the culmination of fear and disease. Fear was represented by a breakout in the Volatility Index (VIX) and the disease was related to the sovereign debt crisis unfolding in the Eurozone. The violent reaction by the Greek citizenry to proposed austerity measures paired with grumblings coming from multiple Eurozone nations ignited fear among traders and investors alike.
I am not an expert on debt instruments, but it seems that there is a considerable amount of systemic risk within the debt structure of the Eurozone. When the notional derivatives such as credit default swaps are factored into the equation the risk to the global financial system intensifies significantly. The real question is who is holding the counterparty risk on the other side of the Greek debt? Even if the Greek situation is resolved without default, what is going to happen to Spain and Portugal’s debt?
The solvency of many of the Eurozone nations has come under question and the price action in the Euro currency is indicative of the fear present among market participants. I believe that the economic disaster that is unfolding in Europe currently will eventually manifest itself stateside. Austerity measures either through higher taxes, monetization of our public debt, and a complete restructuring of entitlement programs is likely to occur. However, in the meantime domestic markets will struggle to gain their footings in the face of a strong U.S. Dollar. The strength of the U.S. Dollar Index represented by the ETF UUP on Wednesday helped place selling pressure on U.S. equities and commodities alike. The daily chart of UUP is shown below:
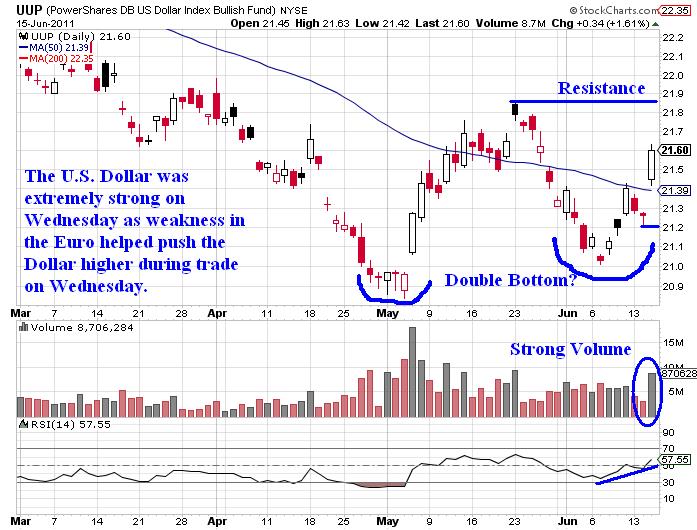
If the U.S. Dollar continues to rise, the impact the increase in value of the Dollar will have on U.S. financial markets could be debilitating for equities. Poor economic data, continued housing problems, and the political uncertainty surrounding the debt ceiling all make for a potentially dangerous situation for U.S. capital markets. With this much fear and uncertainty in the marketplace and volatility stemming from a variety of issues related to the Eurozone, investors are fearful. The spreading disease of the sovereign debt contagion is rapidly infecting global financial markets and if handled inappropriately could drastically alter the entire capital market construct.
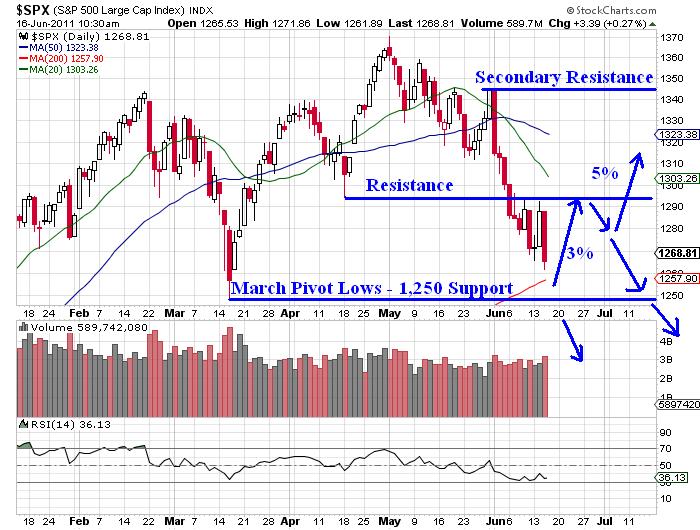
Instead of worrying about all of the fear and uncertainty in the market place, I look at market internals, market cycles, fundamentals, and technical analysis as guides for shaping my approach to trading. We are on the verge of a major inflection point for financial markets, specifically equities. While it might surprise readers to know, I am leaning towards a near term bottom in the S&P 500. The S&P 500 could rally to the 1,305 (SPX) price level (20 Period Simple Moving Average) which represents an increase of 3%. It is also feasible that we may witness a test of the 50 period moving average on the daily chart of the S&P 500 (SPX)which would represent an increase from Wednesday’s close of over 5%. Markets do not move in a straight line. While investors and traders may expect a breakdown in price action, rarely is the crowd correct.
The daily chart of the S&P 500 with its annotations shown below illustrates my thought process as it relates to near term price action for the index:
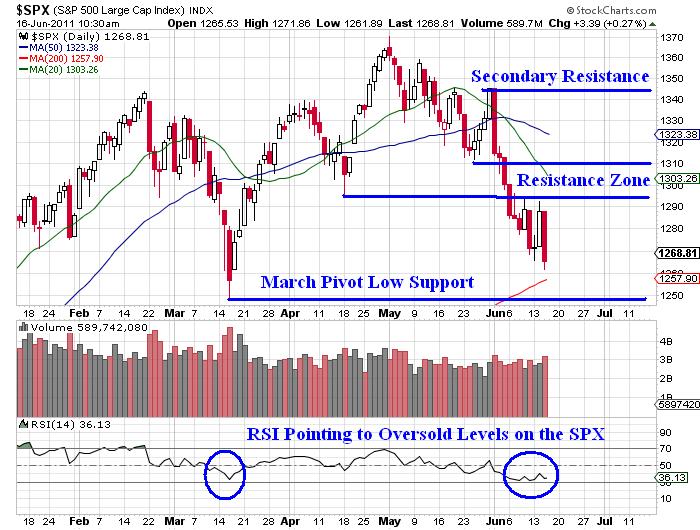
If price action breaks below the March pivot lows a panic induced selloff could begin and the next leg of the secular bear market will likely be underway. We may have already initiated the secular bear with the recent downturn, but I will remain neutral until the March pivot lows are broken. If price action breaks through the March lows and we see multiple days with daily closes below the 1,250 (SPX) price level I will become very bearish. The chart below illustrates the key price levels if the SPX breaks down:
While many readers may find this interesting, today members of my service at OptionsTradingSignals.com were able to lock in gains on an SPY position we initiated late last week. I initiated a SPY 125 Put Calendar spread which I converted to a double calendar spread on Tuesday. The position will produce profits if price action on the SPY remains between around $123.50 / share and $130.21 / share at the close this Friday (June Expiration).
During the nasty selloff today, the implied volatility of the SPY Double Calendar Spread was juiced and we were able to take profits on the position and lock in a 13% gross return based on maximum risk. We have the remainder of the position on currently with stop levels in place. If price cooperates, the trade offers a potential return of around 20% near the close this Friday.
Calendar spreads work great in an environment where volatility levels are rising and they profit from time decay (Theta) which is a mathematical certainty. Recently the service has been producing solid gains for members using calendar spreads during this choppy price action. While I like to use other trade constructions, calendar spreads have produced outstanding risk / reward opportunities for astute option traders and I will not hesitate to use any tool that is working in a particular market climate.
A Brief Trading Lesson
Members of my service know that I regularly watch a variety of underlying indices and sectors to get a feel for the broad market. Besides the VIX, one of the most critical ETF’s for traders to monitor is the financials. If you are new to trading or are trying to learn, it is critically important to understand that the S&P 500 has an arduous time rallying if banks are selling off.
In contrast, when the financials are holding up well or are working higher and the broader tape is trading flat or slightly in the red it offers a clue that the broader market may be preparing to move higher later that session or the following day. Yesterday (Tuesday) the financials were warning traders and investors into the close that today could be troublesome. The daily chart at the close on Tuesday shows the financial ETF XLF’s recent price action:
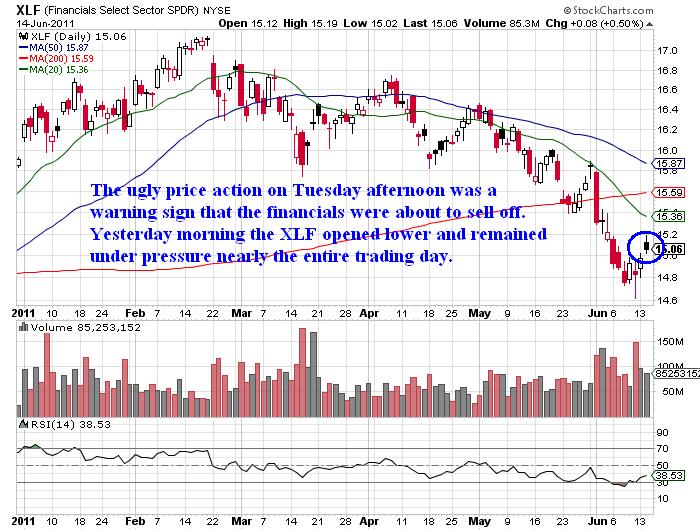
The ugly close for financials was a warning and investors and traders who did not pay attention to the financials had a rough day today. The only long position that I was holding today was a long GLD position. Gold held up nicely today and we have some nice gains for the trade, but the key point to make is that by noticing the price action in the financials late Tuesday afternoon prevented me from initiating a poorly timed long trade.
Conclusion
Given the amount of uncertainty and risk associated with current price action in the S&P 500, I would urge readers to monitor risk closely and review open positions. While I do not necessarily believe a horrific selloff or a Black Swan event is waiting in the shadows for unsuspecting traders and investors, it is impossible to rule out a breakdown of the key pivot lows from March of this year. I am leaning toward the mindset that a short to intermediate term bottom may be forming, but I will not be doing any of the heavy lifting.
I will wait patiently for signs that price action is going to reverse before getting involved. Trying to pick tops and bottoms is a fool’s game, particularly when the game is changing rapidly based on news coming from Europe which can dramatically alter the tape. Risk is extremely high at inflection points such as the one we are currently near. Some of the best traders I know are successful because they refrain from trading when price action is volatile and risk is abnormally high. Sometimes sitting on the sidelines and listening to Mr. Market talk can be the best trade of all!
If you would like to be informed several times per week on SP 500, Volatility Index, Gold, and Silver intermediate direction and options trade alerts… take a look at http://www.optionstradingsignals.com/specials/index.php today for a 24 hour 66% off coupon, and/or sign up for our occasional free updates.
J.W. Jones is an independent options trader using multiple forms of analysis to guide his option trading strategies. Jones has an extensive background in portfolio analysis and analytics as well as risk analysis. J.W. strives to reach traders that are missing opportunities trading options and commits to writing content which is not only educational, but entertaining as well. Regular readers will develop the knowledge and skills to trade options competently over time. Jones focuses on writing spreads in situations where risk is clearly defined and high potential returns can be realized.
This article is intended solely for information purposes. The opinions are those of the author only. Please conduct further research and consult your financial advisor before making any investment/trading decision. No responsibility can be accepted for losses that may result as a consequence of trading on the basis of this analysis.
© 2005-2022 http://www.MarketOracle.co.uk - The Market Oracle is a FREE Daily Financial Markets Analysis & Forecasting online publication.