


Stock and Commodity Market Opportunities Galore
Stock-Markets / Financial Markets 2011 Jun 19, 2011 - 07:18 AM GMT

 Last week I left readers with this chart, and whilst we have witnessed some choppy price action, we still have yet to confirm a potential low in place, although over the past 2 weeks, we did see 2 attempts for a low to be in place, and we were looking at buying the pullback, there is no need to catch a falling knife or chainsaw, we waited for the market to show us some evidence 1st and confirm a potential low and look to buy a pullback, as its low risk, but on both occasions it slipped through our key support areas, so we once again flipped and got short. We don't have any issues with flipping our bias if price action suggests it.
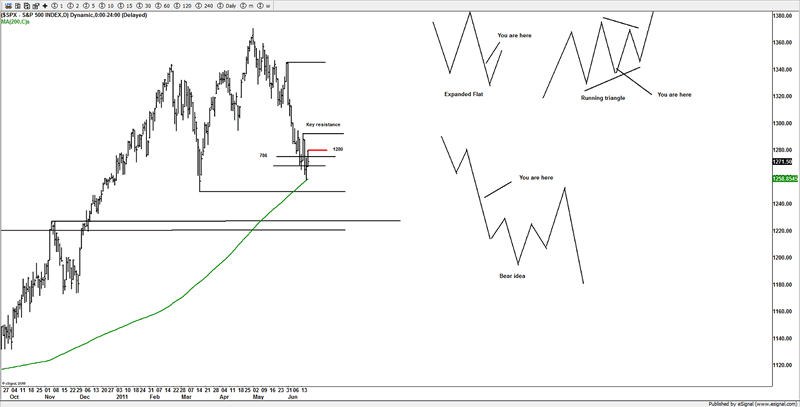
Right now 1280SPX continues to be a thorn in the side of the bulls, twice its been rejected this week, so we still suggest that the trend is still down against that area, although it's been getting very choppy over the past few days, which could be a precursor to a better bounce, or a low setting up, it's that bounce that should help us confirm or negate some patterns I am working with.
I have already started to read some bearish articles in the press, so the sentiment is ripe for a reversal, if the market can carve out a low, the only issue is the market is still weak, its keeps trying to make an attempt to rally but its keeps getting smacked down again, the signature on the bounces has not been convincing enough. Sentiment alone will not create a low or see a rally, sentiment can remain far bearish or bullish, for far longer than you think, just like oversold or overbought, those conditions can last far longer than your account can stay solvent, when the only truth to trading is what price is doing, this is why I don't put much faith into oscillators or sentiment readings unless the trends have a completed looking pattern, or negates an idea I am working with, but then price is what negates or confirms an idea, whilst I think it's good to have ideas, you also need to have areas of confirmation or negation, as looking for that elusive top or bottom, can see many a trader bankrupt before it arrives, when all you really needed to be doing was waiting for a confirmation, not top or bottom tick and looking for that "hero call".
This is where it can get very dangerous for the bulls, as I pointed out last week, a test of the 200DMA should see some sort of bounce, if the bounce is weak and big buyers don't support the markets, you have a serious situation and potentially see a heavy move lower, the very fact this still can't get back above 1280SPSX, is not an encouraging sign for the bulls, so we remain bearish under that area, and should the market finally break above, we will get neutral/bullish and re-evaluate, but we are not in the business of predicting crashes or depressions with super-cycles or cycles, from time windows or moon phases etc, we just follow and respect what price action tells us. A good strong move above 1280SPX then 1294SPX would certainly be encouraging for the bulls.
The only thing that pays is what price is doing.
We use our key support and resistance areas to keep us on the right side of the trend, it's that simple, if we are not sure, we step aside till we are confident to get back into the market, or go and find another market to trade, that's the great thing about monitoring many markets, if we don't like a particular market, we leave it and look elsewhere.
Russell 2000
If you look on the daily chart you can see its coming into some decent support, and it's testing its 200DMA and previous resistance areas that should be support, but talking a closer look, potentially suggests breaking that area 1st, and then seeing a rebound, and the obvious place for sell stops is just under this confluence of support. The market can do some evil things, and one of them is to take out the majority of sell or buy stops and just over or just under key/obvious support and resistance and then reverse, I am sure readers have had this happen many times before.
Think about it for a second, if you were a market maker or a local in the pit, where would you think the majority of stops are going to be placed?? Right!!!! Exactly, just under or just over key support and resistance area that everyone can see, have you noticed the failed breakdowns or breakouts that you see on a chart? Well those are buy and sell stops runs, probing for stops.
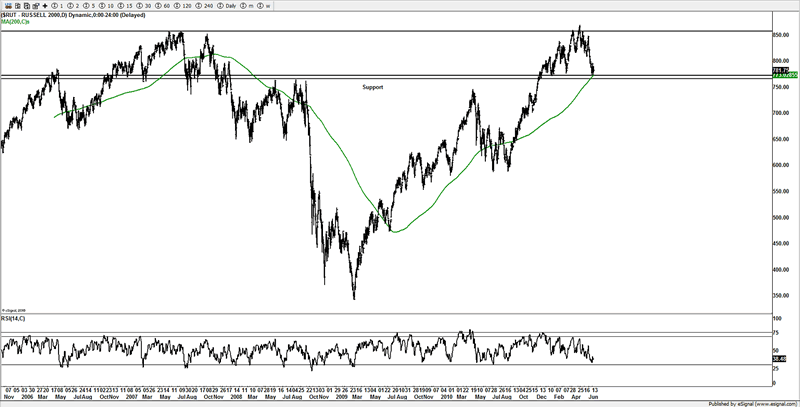
So again, I want to point out, it's the reaction from the 200DMAs that have been touched in most major US markets (some having pushed under like the NDX) that will help confirm if the bulls really want to buy this market or not.
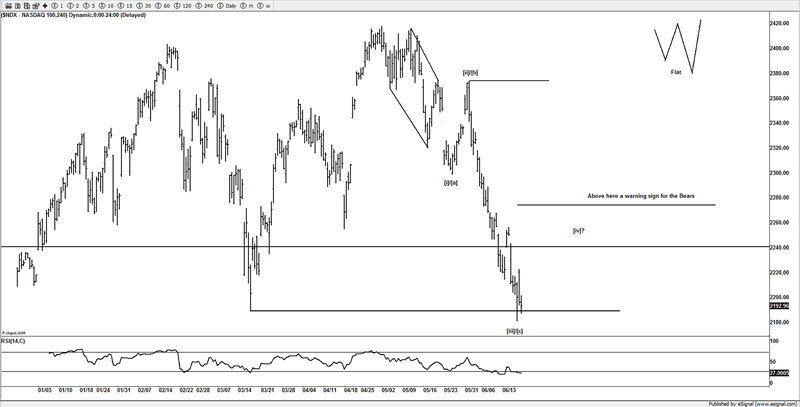
NDX
The NDX has broken through its March 2011 lows, although this is support, its barely breached it, the idea is still potentially in a flat, but as long as under 2255, we will respect the trend being lower, but there could be a 4th wave bounce here as this market appears to off stretched further than the other majors markets, but still only 3 waves down, but the trend is lower against 2255.
With 3 waves down, we still not have a confirmed 5 wave decline, so it's important on the reaction here to any bounce that the bulls get aggressive, and this could yield to more downside here if any subsequent bounce is weak.
The bull idea is that a flat is taking shape and like the SPX chart we should find a low shortly as the flat would need to push under the March 2011 lows, which it has done on the NDX and R2K, but yet to do it on the SPX and DOW, so we may have further to push lower, to shake out the early buyers.
The alternative that this is already in a 3rd wave and head far lower, and whilst it's not something I am totally convinced off, if the market is unable to rally and get past key resistance areas, then it will continue to push lower, and one thing we are not going to do is argue with price.
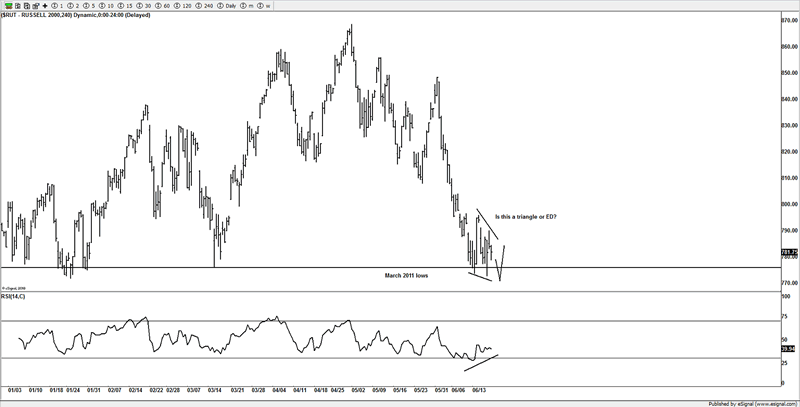
Potential Ending Diagonal
It's not what I would call picture perfect, but we might seeing an ending diagonal (ED), it sure has a wedge look to it, but it would look better with a new low then reverse. It requires a minor move under this week's low and then to see an aggressive reversal, but as long at the market remains under 1280SPX the trend is down. A trend reversal happens above 1294SPX.
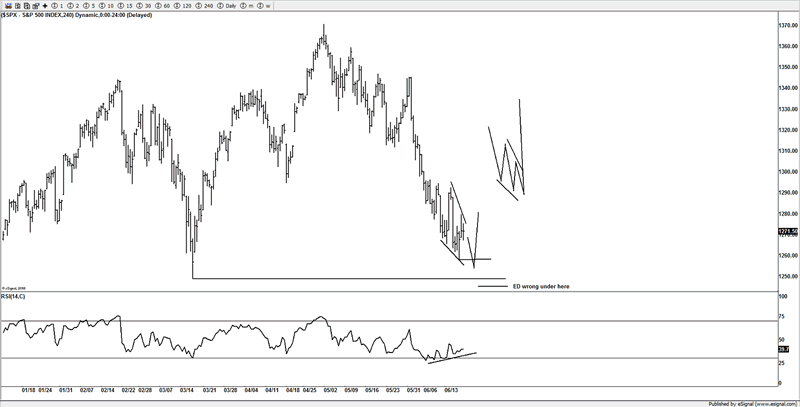
Looking at the R2K, you can see it's starting to chop like the SPX, and that does suggest a potential basing for an ED or triangle, the chop tends to happen at the end of a trend, it would need a big move lower to kill this pattern of a potential reversal setting up. This is a bullish setup from the ED idea. I particularly like the RSI divergence in both markets. The bearish potential is that we simply continue lower and see heavy downside once the 200DMAs are lost as sell stops can get triggered, but the ED setup shown here, should be a warning to any bearish trader that the potential to reverse is a setup that needs to be taken seriously.
HUI
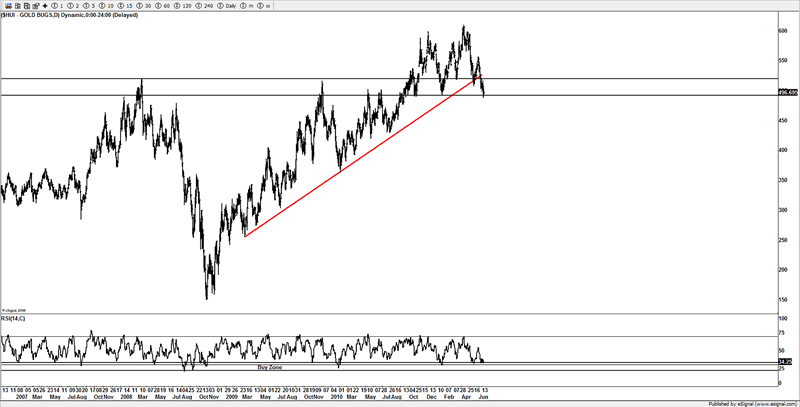
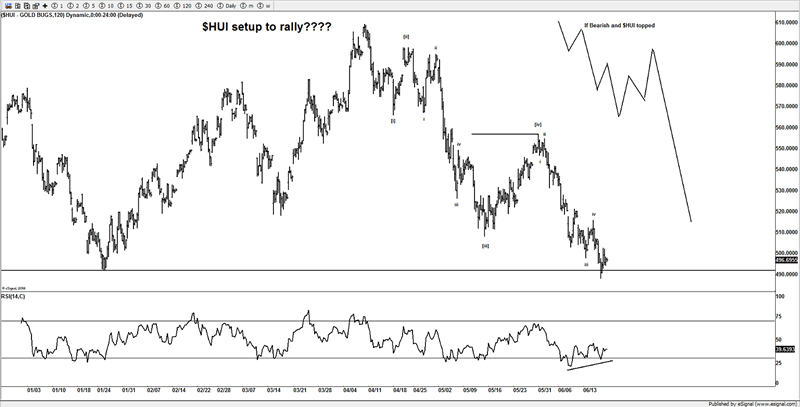
With gold still hovering in a potential larger triangle, I tend to think now that the HUI could be on the cusp to reverse as I can count a 5 wave decline from the highs made this year, and we are back to important support, with a virtual completed 5 wave pattern, gold stocks could help the US markets run higher, as imo this is the place to be cautious if a bear on gold stocks, but the RSI buy zone has been tagged and with good wave structure, it looks a great setup with a low risk entry and is something we are watching for evidence of a reversal next week, for at least a bounce, if not yearly highs, if gold stocks have topped, we will know on the next bounce, as if its only 3 waves, then the setup will be a move lower.
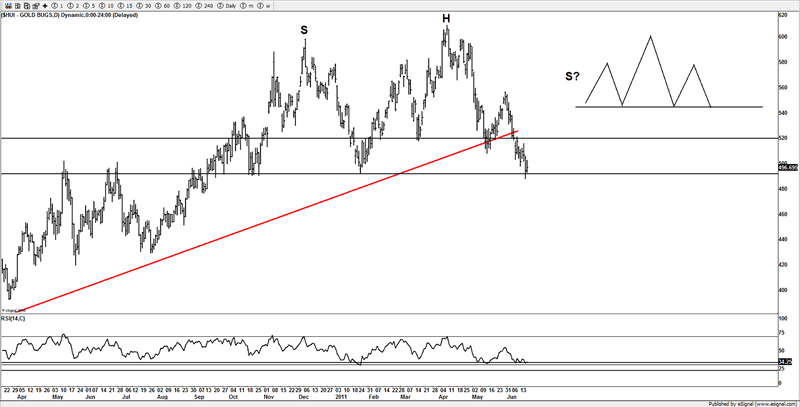
The obvious H&S potential pattern is something the bulls need to take note of, as we are on the neck line, but the next bounce will hopefully confirm as if only 3 waves, then its setting up to push lower. Around $550-570, we will be following both sides of the trend here, as there is something for both bull and bear alike.
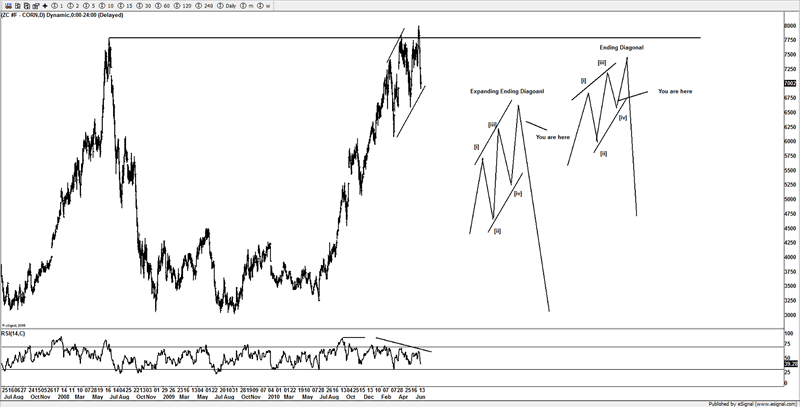
Corn
A market that is not really traded much by traders, but is something we have been watching for a while and confident that a breakdown was setting up. Corn reversed off a yearly high and has a very impulsive look to it, we suspect it's just finished a rare expanding ending diagonal and the reaction from that high has been severe, we went into last week with 2 patterns, but the reaction now really suggest the high is likely in and far lower prices over the coming weeks and month, as a multi-month high likely in place, maybe even a yearly high, the "trade of the year" could be right under traders noses and only a few will be trading it.
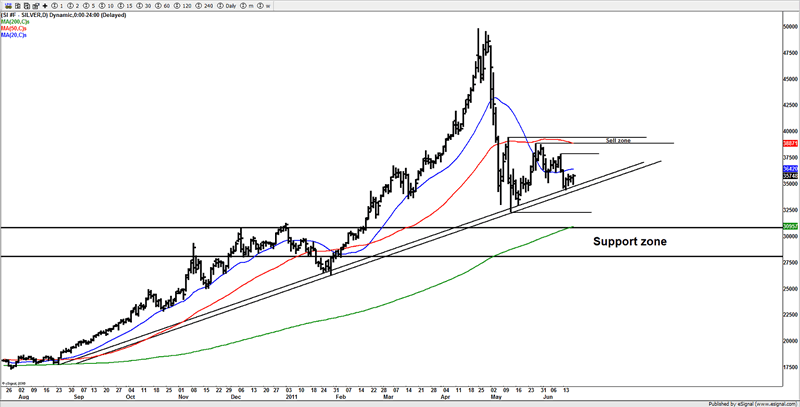
Silver
Silver continues to be supported by its uptrend line, but I still think this is just holding, and what tends to happen after a huge reversal like we saw in oil and silver is that they have an initial leg down, bounce around, then setup a new move lower, we appear to be holding and whilst we can chop around a while longer, I see nothing yet to suggest a more bullish aggressive stance is needed, in fact as long as it holds under the $38-40 area I suggest selling rallies with a view to eventually seeing towards under $30 and a 200DMA test, we particularly like the short side, if a failure to get above $36-36.50, which is the 20DMA.
There has been some great trades for members this last week alone, some great moves in the FX markets, I simply don't have enough space to show ideas past and present in these pages, but the coming few months is looking great for trading conditions, the markets are moving well, and those that make the effort are being rewarded well, as these are the conditions we thrive on, if we don't like a market we simply bin it and find something else, it's that simple. Come and join us.
Until next time.
Have a profitable week ahead.
Click here to become a member
You can also follow us on twitter
What do we offer?
Short and long term analysis on US and European markets, various major FX pairs, commodities from Gold and silver to markets like natural gas.
Daily analysis on where I think the market is going with key support and resistance areas, we move and adjust as the market adjusts.
A chat room where members can discuss ideas with me or other members.
Members get to know who is moving the markets in the S&P pits*
*I have permission to post comments from the audio I hear from the S&P pits.
If you looking for quality analysis from someone that actually looks at multiple charts and works hard at providing members information to stay on the right side of the trends and making $$$, why not give the site a trial.
If any of the readers want to see this article in a PDF format.
Please send an e-mail to Enquires@wavepatterntraders.com
Please put in the header PDF, or make it known that you want to be added to the mailing list for any future articles.
Or if you have any questions about becoming a member, please use the email address above.
If you like what you see, or want to see more of my work, then please sign up for the 4 week trial.
This article is just a small portion of the markets I follow.
I cover many markets, from FX to US equities, right the way through to commodities.
If I have the data I am more than willing to offer requests to members.
Currently new members can sign up for a 4 week free trial to test drive the site, and see if my work can help in your trading and if it meets your requirements.
If you don't like what you see, then drop me an email within the 1st 4 weeks from when you join, and ask for a no questions refund.
You simply have nothing to lose.
By Jason Soni AKA Nouf
© 2011 Copyright Jason Soni AKA Nouf - All Rights Reserved
Disclaimer: The above is a matter of opinion provided for general information purposes only and is not intended as investment advice. Information and analysis above are derived from sources and utilising methods believed to be reliable, but we cannot accept responsibility for any losses you may incur as a result of this analysis. Individuals should consult with their personal financial advisors.
© 2005-2022 http://www.MarketOracle.co.uk - The Market Oracle is a FREE Daily Financial Markets Analysis & Forecasting online publication.