


Gold Damaged by Heavy Volume Selling
Commodities / Gold and Silver 2011 Jun 26, 2011 - 01:17 PM GMTBy: Merv_Burak

 The week started encouragingly but along came Thursday and Friday and that was it. The two day decline was with increasing volume action, which is significant. Expect a recovery soon but not a full recovery. Too much damage done by the past couple of days.
VOLUME ACTION
Last week I briefly mentioned volume action relative to the potential head and shoulder pattern. I’ll mention, again briefly, some additional suggestions when viewing the daily volume action.
In general, the actions of speculators go something like this. They get enthusiastic and tend to jump on the buy side when prices are rising. They lose enthusiasm and tend to stop buying (but NOT necessarily start selling) when prices are declining. So, it is NORMAL for volume to increase during a market advance and decrease during a market decline. Such normal action does not necessarily verify a bull or bear trend. Keeping these normal actions in mind there are three events when volume action may be significant:
- INCREASING volume on a market down move (BEARISH).
- INCREASING volume, far more than the normal increase, on market up moves (BULLISH). Caution, each security has its own level of “normal” upside volume.
- DECREASING volume during market advances, especially during the early stage (BEARISH).
There is one additional volume action to watch out for, increasing upside volume AFTER a significant market advance has taken place. This very often predicts a market top ahead, although the length of the subsequent reaction varies from a brief down turn to a trend reversal.
There are a lot of different views about volume action and the above suggestions are just a few of these views (mostly my own).
GOLD
LONG TERM
Despite the sharp gold decline over the past couple of days the long term indicators have not basically changed. There are some negative hints in the momentum indicators, otherwise all is well. Gold remains above its positive long term moving average line. The long term momentum indicator remains in its positive zone but has moved below its now negatively sloping trigger line. In addition, the momentum indicator is now below its level of early May when the price of gold was some $30 lower than it is today. The volume indicator had continued to move higher into new high territory early in the week although it has retreated somewhat by week end. The indicator remains above its positive sloping trigger line. The long term rating remains BULLISH.
INTERMEDIATE TERM
The potential head and shoulder pattern mentioned and shown last week can be considered an intermediate term pattern as it has taken a few months to develop. The gold price has now dropped below its neckline and both the intermediate and short term momentum indicators have broken below their support levels. We now can say we have a valid head and shoulder pattern (rather than a potential one) with a projection to around the $1400 level.
Gold has now closed below its intermediate term moving average line. The line itself has turned to the horizontal but not quite yet to the down side. As for the intermediate term momentum indicator, it remains in its positive zone but below its negative trigger line and as mentioned above, below its previous support level. The volume indicator is still positive but getting very close to breaking below its trigger line. Despite the sharp move downward gold has not quite gone to the full bear status. On the intermediate term the rating has dropped to the – NEUTRAL level, one level above a full bear. The short term moving average line remains above the intermediate term line for confirmation that a full bear is not yet confirmed.
SHORT TERM
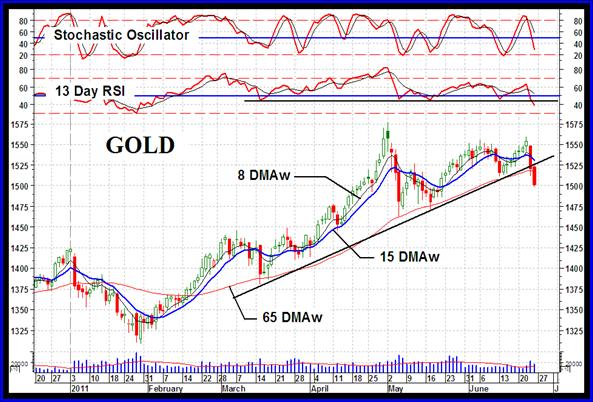
One can see many things in the short term gold chart. Let’s just zero in on a few items.
As mentioned earlier, the potential head and shoulder pattern is now a confirmed head and shoulder with a neckline break as well as a momentum support level break. In addition, as the price of gold was making a new rally high on Wednesday the momentum indicator was holding back and was not able to break above its previous high from early June. Interesting, how did the indicator know of a looming oil plunge taking gold with it the next day?
Looking at the Stochastic Oscillator it entered its overbought zone on Tuesday and as the metal was making a new high on Wednesday the OS was only able to move sideways, a prelude to a reversal. Hmmmm!
So, where are we as far as the short term is concerned? Gold has now moved below its short term moving average line and the line has turned downward. The short term momentum is in its negative zone below its negative sloping trigger line. The daily volume activity has picked up steam on Thursday and Friday, both down days in the price and a bearish sign. Overall the short term rating is BEARISH. The very short term moving average line is now below the short term line for confirmation of this bear.
As for the immediate direction of least resistance, I’ll go with the down side although we could see a bounce after such a plunge of the past couple of days.
SILVER
POWER OUTAGE
Just as I got to this portion of the commentary we had a power outage that lasted for several hours and put my schedule totally out of order. I had lived in California (throughout the 1960’s and early 1970’s) for some 13 years and never experienced a power outage. On moving to Quebec in 1973 the first thing I experienced was a power outage. I have since found out that power outages in this Province (I don’t know about the rest of Canada) is not an unusual event. Over the years I have experienced more than one outage that lasted for many, many days, including our famous “Ice Storm Outage”.
Because of this delay I am cutting my commentary at this point and hope to have a complete one next week.
Well, that’s it for this week. Comments are always welcome and should be addressed to mervburak@gmail.com.
By Merv Burak, CMT
Hudson Aero/Systems Inc.
Technical Information Group
for Merv's Precious Metals Central
For DAILY Uranium stock commentary and WEEKLY Uranium market update check out my new Technically Uranium with Merv blog at http://techuranium.blogspot.com .
During the day Merv practices his engineering profession as a Consulting Aerospace Engineer. Once the sun goes down and night descends upon the earth Merv dons his other hat as a Chartered Market Technician ( CMT ) and tries to decipher what's going on in the securities markets. As an underground surveyor in the gold mines of Canada 's Northwest Territories in his youth, Merv has a soft spot for the gold industry and has developed several Gold Indices reflecting different aspects of the industry. As a basically lazy individual Merv's driving focus is to KEEP IT SIMPLE .
To find out more about Merv's various Gold Indices and component stocks, please visit http://preciousmetalscentral.com . There you will find samples of the Indices and their component stocks plus other publications of interest to gold investors.
Before you invest, Always check your market timing with a Qualified Professional Market Technician
Merv Burak Archive |
© 2005-2022 http://www.MarketOracle.co.uk - The Market Oracle is a FREE Daily Financial Markets Analysis & Forecasting online publication.