Here Comes Stock Market 2008.2: My 5 Canaries
Stock-Markets / Stock Markets 2011 Aug 09, 2011 - 06:55 PM GMTBy: JD_Rosendahl
 I’ve been telling friends and family the past couple of months that 2008.2 is coming, and it may have started with the recent sell off in the stock market.
I have 5 things (Canaries) that I’m listening to too, to let me know we are in serious economic trouble, where the economy and stock market could have another period like 2008 or worse.
Collectively, I think my 5 canaries are a simple look at future economic health, major stock market components, and the appetite for risk. What else do you need to know? It's really as simple as that for now, and here are my 5 canaries:
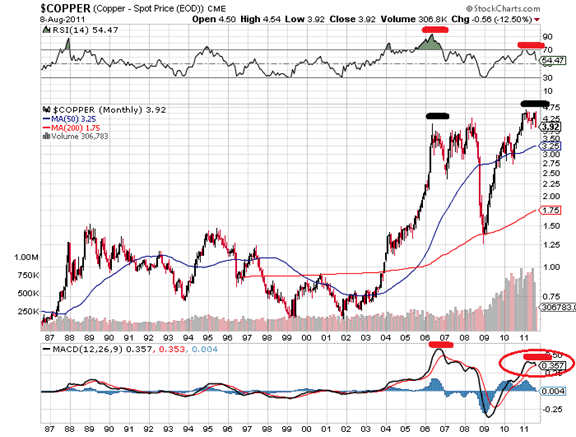
Copper: The first Canary is copper. It’s an economically sensitive metal that usually does well during good times and bad during difficult times. Below is the monthly chart of copper. What you’ll notice is the massive divergences in price compared to the MACD and RSI with price and the MACD about to roll over.
Why is this important? We had the very same divergences on the monthly chart of the stock markets in 2007 before they sold off. And, if copper is going to go through that kind of sell off based on divergences, shouldn’t we expect a horrific economy with it? Yes.
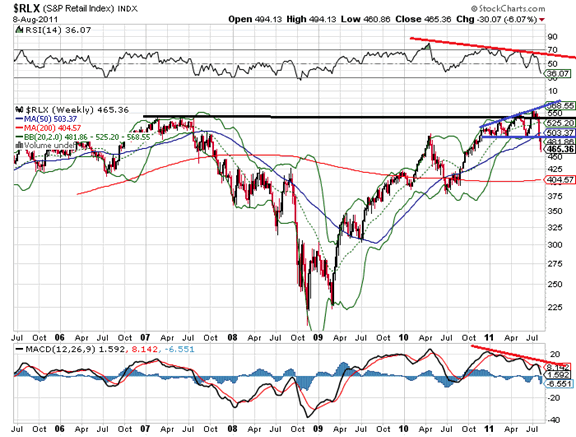
Retail: Too much of the US economy is tied to retail spending and not one thing has really improved on the Main Street economy. In fact: Will This be a Problem? US Is at the Start of 500-Day Retail Recession: Analyst . If that is the case, wouldn’t you expect the retail index to sell off first as a forward looking discounting mechanism? Yes.
Below is the weekly chart of the retail index. It’s tried very hard to make a new high in price over the 2007 highs. But in so doing that it has formed a broadening wedge top pattern. That’s bearish. Price has failed at the 2007 price highs. That’s bearish. Now price has broken below the bottom wedge line. That’s bearish.
The retail index is providing that early warning sign you would expect prior to a 500 day retail spending recession. If retail is going into recession, how do you think the rest of the US economy will do?
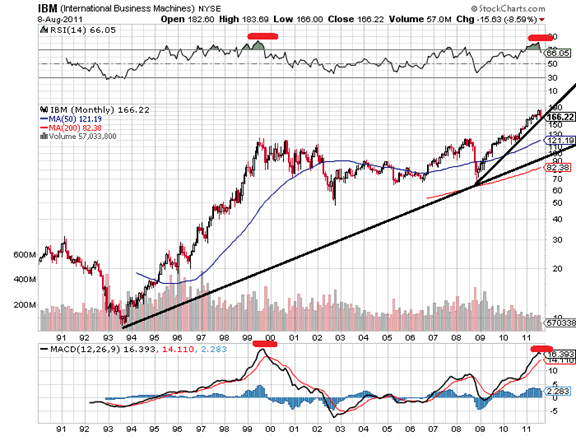
IBM: This company is almost 9% of the weighting in the Dow Jones Industrials. It’s the largest component by a mile. If IBM is going to have a large correction, do we not have to assume the rest of the stock market will too? That seems logical.
Below is the monthly chart of IBM and guess what? There are those divergences forming again on the monthly chart much like copper, and the stock markets back in 2007.
If price breaks down and the MACD rolls over, we should be into a correctional phase of size for IBM, which should put pressure on the US economy and the stock market. If all we do is fall to the second uptrend line, that's a very large correction and big pressure on the entire market.
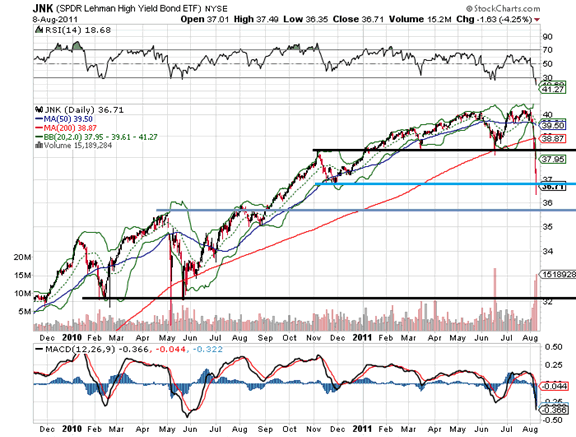
JNK: The junk bond market has correlated well with the stock market from the 2009 stock market bottom. It has served as the risk on or risk off indicator. When it’s rising stocks have done well and indicates an appetite for risk. The complete opposite seems to hold true as well.
Unfortunately, JNK has not been around that long so we have limited charting time frames to work with. However, on the daily chart below we see it is breaking down. A continuation of a price break down in JNK is a continual confirmation of the risk off trade, which indicates stock market weakness, which indicates economic weakness to follow.
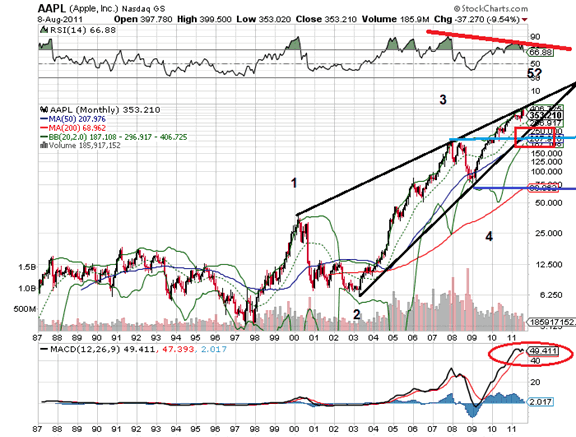
AAPL: Apple is to the NASDAQ as IBM is to the Dow Jones Industrials. With a break down in AAPL I would expect a break down in the NASDAQ.
Below is the monthly chart of AAPL. There are no divergences on the MACD, but we have one on the RSI. We have 5 waves up, and if that Elliott Wave count is right, then we should expect a sell off back to the prior 4th wave at $75. A more conservative sell off would be back to cluster support where we have the uptrend line, the 50 month MA and lower BB in a tight zone around $200-250. In either case, a selloff in AAPL of size to those levels should put immense pressure on the market.
The Bull View: To give equal time to the bulls, the $SPX needs to trade above 1,250/60 to regain a bullish technical structure. That’s not my view, but if it happened in the coming months then the bulls could cheer once again.
Otherwise we need to review the bearish indicators above:
The Bearish View:
Copper: on the verge of a major divergence roll over. That would be bearish.
Retail: has already broken down on the weekly chart from a topping pattern. That is bearish
IBM: Following copper with a divergence forming. That would be bearish.
JNK: Continues to break down with the stock market: That is bearish.
AAPL: might be on the verge of a MACD and price roll over and break down: That would be bearish.
Here comes 2008.2
Like canaries in a coal mine, my 5 canaries are starting to go silent. We are at critical junctures for IBM and AAPL. Retail has already broken down. And copper is very close. If the Canaries continue with the bearish theme I expect 2008.2 is just around the corner. It should be and feel every bit as bad as 2008 if not far worse in many cases.
I do expect a bounce in the stock market coming. That bounce might hold the key to the puzzle. If the bounce can regain 1,260 on the $SPX then the bulls have regained the market. I personally don't think that happens though. If that bounce fails and my 5 canaries continue downward, we could be on crash and deflation alert.
Risk/Reward
It's seems like the market went up on the back of big institutional buying and it's going down on big institutional selling. This market has too much risk in it for most individual investors. Individual investors need to revisit their wealth strategy and try to save what they have during the pending 2008.2.
It's not about whether you can make money, but rather not loosing what you have and does the risk of being in this market fit you! We exited our last two longs a day before this selloff because the market didn't look like it could push higher. I wasn't expecting this sharp selloff now, but it is what it is. Investors should become defensive in nature. If we get the bounce I'm looking for, that might serve as the opportunity to exit the market, but you should have some plan in place to protect what you have.
Hope all is well.
By J.D. Rosendahl
www.roseysoutlook.blogspot.com
J.D. Rosendahl was a former stock broker/investment consultant (currently not licensed) before becoming a Commercial Banker for the past 14 years. He manages his family's wealth, helping them avoid the high tech bubble and the real estate bubble melt downs and preserving wealth.
© 2011 Copyright J.D. Rosendahl - All Rights Reserved Disclaimer: The above is a matter of opinion provided for general information purposes only and is not intended as investment advice. Information and analysis above are derived from sources and utilising methods believed to be reliable, but we cannot accept responsibility for any losses you may incur as a result of this analysis. Individuals should consult with their personal financial advisors.
© 2005-2022 http://www.MarketOracle.co.uk - The Market Oracle is a FREE Daily Financial Markets Analysis & Forecasting online publication.


