


Stock Market Wild Week
Stock-Markets / Stock Markets 2011 Aug 13, 2011 - 05:58 PM GMTBy: Tony_Caldaro

 The US market opened the week on a gap down to SPX 1182, hit 1102 on tuesday, then spent the rest of the week trading wildly between the 1120′s and 1180′s only to close the week at 1179. The FED met on tuesday stating they will keep rates low for the next two years, and the economy is weaker than expected. The weekly economic reports were mostly to the downside. Retail sales, weekly jobless claims and the budget deficit improved. Productivity, wholesale/business inventories, and the trade deficit all declined.
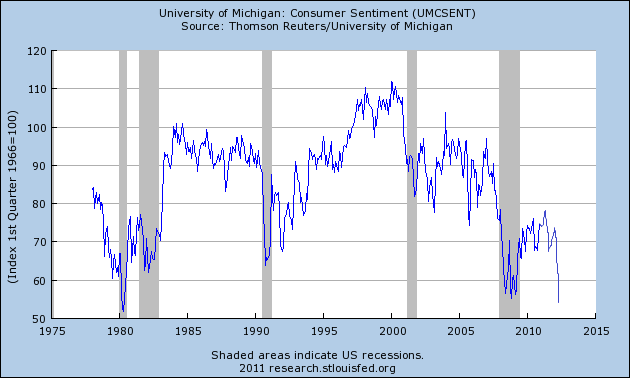
Consumer sentiment, however, dropped to its lowest level in over 30 years. Yes, even lower than 2009. With an economy that is 70% consumer driven, this suggests trouble ahead. For the week the SPX/DOW were -1.6%, and the NDX/NAZ were -0.8%. Asian markets lost 2.5%, European markets were -0.8%, the Commodity equity group were -2.4%, and the DJ World was -1.6%. Bonds were +1.8%, Crude dropped 1.6%, Gold gained 5.1% and the USD was flat. Next week Industrial production, CPI/PPI, Leading indicators and Options expiration.
LONG TERM: bear market highly probable
We had been expecting a rising stock market since a few days after the March 2009 low at SPX 667. We even posted a tentative roadmap, based on the existing waves at the time, for the bull market. Early this year the market started to deviate from that projection. Then we started to notice some cracks in the ongoing bull market scenario in June. Starting with this: http://caldaro.wordpress.com/2011/07/12/anticipate-monitor-and-adjust/, we reported the negative technical evidence as it arrived. In just a matter of a couple of weeks we shifted from concern, to a market inflection point with defensive positions warranted, to market breaking down and then bear market highly probable. Everyone should have had sufficient time to adjust accordingly, and hopefully avoid the August debacle.
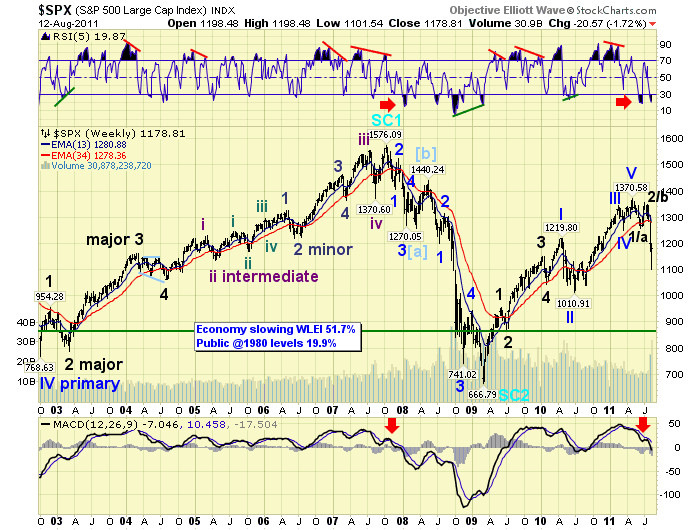
At first we thought this would be a moderate technical bear market without a recession. Now, with consumer sentiment plunging, we’re not so sure. Normal support for a bear market, following a bull market with this wave structure, would suggest support at SPX 1011, Primary wave II. Since we are only three months into this bear market, and we already hit SPX 1102, this level is not likely going to hold. The next major support level is SPX 869, Major wave 2 of Primary I. This appears to be the markets price objective at this time. This suggests after the recent 19.6% decline (SPX 1371-1102) the bear market will probably end with a 36.6% decline, or 26.3% below current levels. We continue to suggest a time factor of either Q3/Q4 2012, or Q3/Q4 2014 if a double bottom.
From time to time over the past few years we have often written about the characteristics of bull and bear markets displayed on the weekly chart. Typically the RSI, above, gets extremely overbought during bull markets and barely oversold. Also, the MACD, below, spends nearly all of its time above neutral during bull markets. Then during bear markets these two indicators reverse. The RSI gets extemely oversold and barely overbought, while the MACD spends most of its time below neutral. Notice the recent transition after the May 2011 bull market high.
MEDIUM TERM: downtrend low SPX 1102
This downtrend started in early July at SPX 1356. Thus far it appears to have declined in four waves: Int. wave i SPX 1296, Int. wave ii SPX 1347, Int. wave iii SPX 1102, and Int. wave iv tentatively SPX 1189. This count suggests Int. wave v has yet to unfold. We did some Fibonacci calculations for the waves of this downtrend, and came up the following numbers. Some interesting wave relationships are potentially developing: Int. i = 60 points, Int ii = 51 points, Int iii = 245 points, and Int iv = 87 points at 1189, or 1.618 Int. ii. Targets: @ SPX 1089 Int. v = 1.618 Int. i, @ SPX 1092 Int. iii = 2.618 Int v, @ SPX 1093 Int. iii thru v = 4.234 Int. i. There is also an OEW pivot at 1090. This certainly looks like a cluster should the OEW 1187 pivot hold as the Int. iv high. A downtrend low at the OEW 1090 pivot would also align with a similar historical structure, under similar fundamentals, displayed in this recent report: http://caldaro.wordpress.com/2011/08/11/history-may-not-repeat-but-it-always-rhymes/.
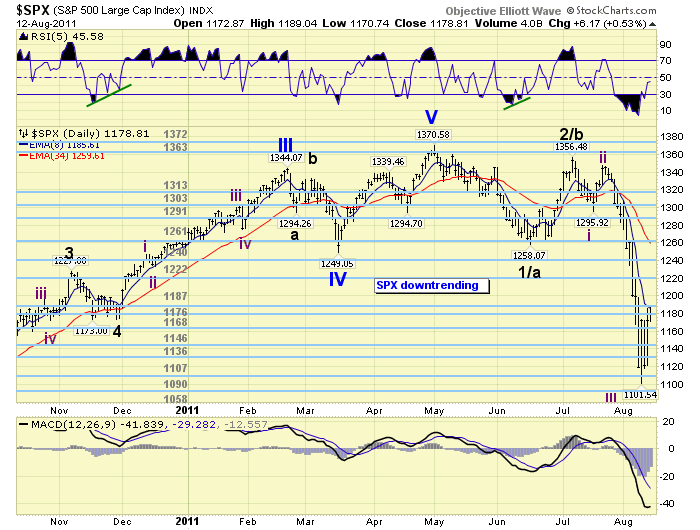
The market has just had the best rally since this downtrend began: (SPX 1102-1189). The previous best rally was Int. wave ii: (SPX 1296-1347). At the recent low the market was the most oversold it had been since November 2008 in the last bear market. The VIX shot up to 48 early in the week, implying 3% daily volatility. It declined into the upper 30′s by week end, implying 2% daily volatility. We added some labels to the charts, and are expecting it to exceed the recent high in the months ahead.
SHORT TERM
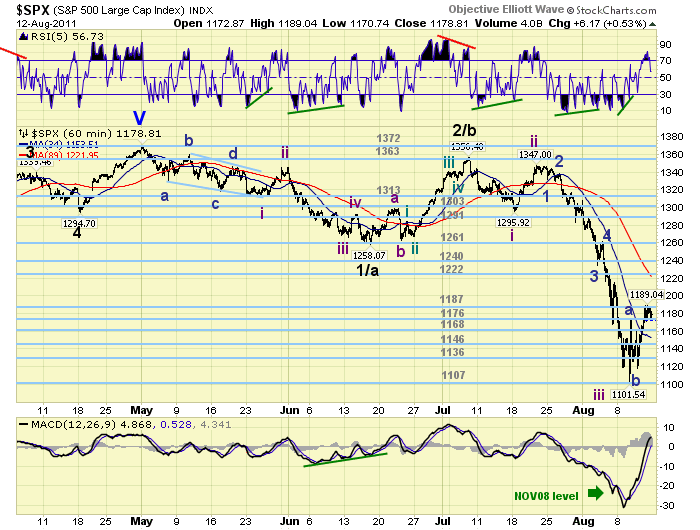
Support for the SPX is now at 1176 and then 1168, with resistance at the 1187 and 1222 pivot ranges. Short term momentum got overbought on thursday/friday, for the first time in three weeks, before tailing off by the end of the day. The market will now have to decline below the OEW 1168 pivot to signal the start of Int. wave v. Should this downtrend bottom at the OEW 1090 pivot and Fibonacci cluster, we would expect the next uptrend to return to the 1187 pivot and even the 1222 pivot in September. The next uptrend will be quite important in determining whether or not this market is doing a 5-3-5 zigzag again, like in 2007-2009, or an abc-x-abc, (abA-B-abC) double zigzag. Depending upon which pattern is developing we should get a better idea of how this bear market is going to unfold. Best to your trading!
FOREIGN MARKETS
The Asian markets were mostly lower on the week for a net loss of 2.5%. Australia had the only gain on the week of the five markets that we track. All remain in downtrends.
The European markets were mixed on the week for a net loss of 0.8%. Both England and Switzerland were higher. All five markets remain in downtrends.
The Commodity equity group was mostly higher on the week for a net loss of 2.4%. Russia was the big loser shedding 11.4%, while the other two gained. All three are in downtrends.
The DJ World index is downtrending and lost 1.6% on the week.
COMMODITIES
Bonds again benefitted from market volatility gaining 1.8% on the week. The 10YR yield dropped to 2.24%, while the FED Fund sensitive 1YR hit a record low at 0.9%.
Crude remains in a downtrend but is displaying some signs of life. It lost 1.6% on the week.
Gold continues its uptrend soaring 5.1% on the week. Silver gained but appears to be going sideways of late.
The USD remains in a downtrend but ended the week flat. The EURUSD lost 0.3%, and the uptrending JPYUSD gained 2.1%. The CHFUSD went parabolic before the Swiss threatened to fix it to the Euro.
NEXT WEEK
A busy economic agenda ahead. Monday kicks it off with the NY FED @ 8:30 and the NAHB housing index @ 10:00. On tuesday we have Housing starts, Building permits, Import/Export prices, and Industrial production. On wednesday the PPI; then on thursday the CPI, weekly Jobless claims, Existing home sales, the Philly FED and Leading indicators. The FED only has one thing scheduled at this time: Congressional testimony from Director Bertsch on tuesday. Best to your weekend and week in these volatile times.
CHARTS: http://stockcharts.com/...
http://caldaroew.spaces.live.com
After about 40 years of investing in the markets one learns that the markets are constantly changing, not only in price, but in what drives the markets. In the 1960s, the Nifty Fifty were the leaders of the stock market. In the 1970s, stock selection using Technical Analysis was important, as the market stayed with a trading range for the entire decade. In the 1980s, the market finally broke out of it doldrums, as the DOW broke through 1100 in 1982, and launched the greatest bull market on record.
Sharing is an important aspect of a life. Over 100 people have joined our group, from all walks of life, covering twenty three countries across the globe. It's been the most fun I have ever had in the market. Sharing uncommon knowledge, with investors. In hope of aiding them in finding their financial independence.
Copyright © 2011 Tony Caldaro - All Rights Reserved Disclaimer: The above is a matter of opinion provided for general information purposes only and is not intended as investment advice. Information and analysis above are derived from sources and utilising methods believed to be reliable, but we cannot accept responsibility for any losses you may incur as a result of this analysis. Individuals should consult with their personal financial advisors.
© 2005-2022 http://www.MarketOracle.co.uk - The Market Oracle is a FREE Daily Financial Markets Analysis & Forecasting online publication.