


The Stock Market Bear Lives On
Stock-Markets / Stocks Bear Market Aug 21, 2011 - 08:14 AM GMT

 Last weeks article was titled "setting up the next decline." I mentioned to readers that we could see a push higher towards the 1200ES area in the early part of the week, but I still suspected we would find a high in that area.
The market made it a little more frustrating that I wanted to see, but it eventually it came good, having put in 2 false breakouts, the 3rd attempt finally cracked lower, a what a move!, it finally made the effort that we put in looking for that 4th wave high all the more worth it.
Sometimes the market likes to kick off the majority of traders before the train leaves the station, and whilst it tried to do that with us, we had a couple of tricks up our sleeve to stick with the plan and looking for that 4th wave high I mentioned in last week's article.
ES
We went into mid week with a idea of seeing the 1200ES area tested, in fact it tested that area on 3 occasions, which made it a little tricky as we had to adjust our ideas, as the market pushed back up to take out buy stops, but we had a great looking setup, that needed some confirmation under 1194ES.
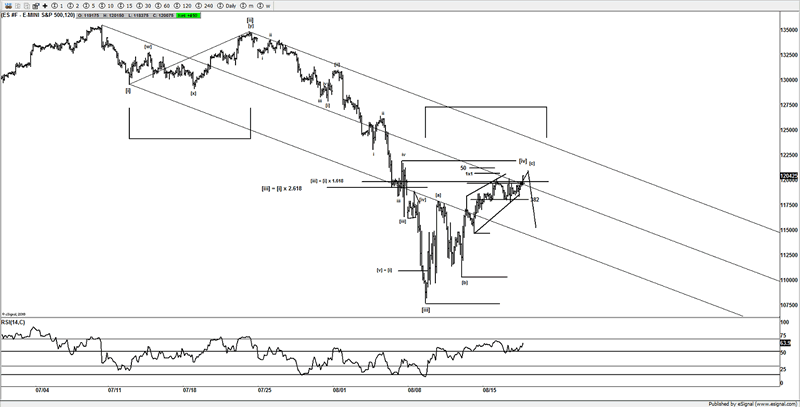
We could not be sure if the market was going to stop at 1204 1210 or run to 1220ES, so rather than try and top tick, traders were advised that if they wanted to sell, we needed to wait till we got some clues on a reversal 1st, the area that we wanted to see broken was under 1194ES. Once under that area I felt the market would have done enough that we could enter short positions with limited risk, and look for that 1077ES test, in what was expected to be a 5th wave.
Well the result could not have gone any better, not only did the reversal setup and reverse as we wanted to see, the aggressive reversal, further confirmed that once under 1194ES we would be on our way to see that new low and our expected target and a test of that globex print at 1077ES.
I suspect not many would have thought that at 1204ES you could have the potential to see 1077ES, buts that what we were looking for. Yet here we are sitting at 1124ES, 80 handles lower, and 70 handles from our confirmation point.
Now there is always the case that the market could surprise us come Monday, but we can deal with that as it happens, for now, we took the money off the table into Fridays close, as the risk for a gap up on some sort of "news bomb" is the risk that traders take having any positions open over the weekend, I tend to prefer the conservative approach and get flat and close down positions, or at least take partial profits. Besides extra interest on FX positions is not exactly my idea of money well spent either.
These days the weekends can be prone to a gap in either direction, remember the $$$$ is not yours till its banked, you can always put the trade bank on, what you can't do however is get back lost potential profits via a gap on Sundays globex open. So getting flat and closing down trades if any were still open seemed to conservative thing to do, and look to initiate those back on Sunday.
SPX
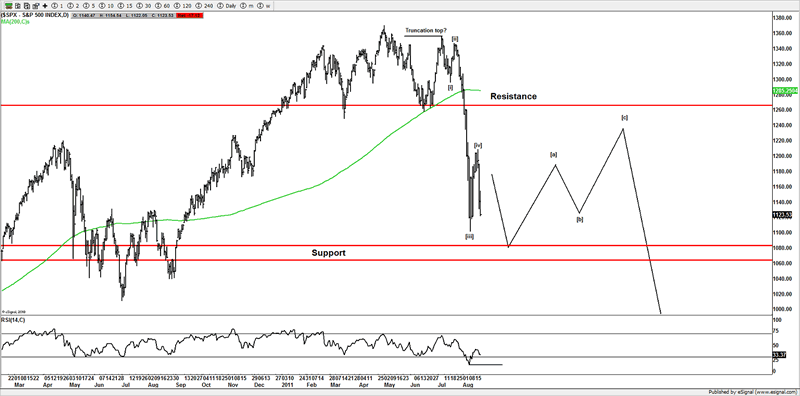
So where does that leave us on the current ideas?
Readers will note that my last few articles I have been working the idea that the markets truncated and we are in the progress of what I think is a 5 wave decline, which can be labeled wave 1 or A, I suspect on a new low, that we will see headlines to the extent that will suggest that we have a bear market etc, being down 20%, and under 1096SPX
That's the sort of interest you want to see, ideally the more bearish the better, as I suspect if we do see new lows, then we will have a lot of fear in the media and traders in general, especially those that bought into the last rally late, as most are now underwater, and I think the market will need to flush out those bulls.
As I write this article, the market has retraced over 78% of the last rally, in a matter of a few days, so the sentiment should be bearish if we see towards our target of 1080SPX. Whilst that's a target, it's not a going to be the point that the market stops dead, it might drop short, it might push further, some of the waves the market has created so far, have gone on to extremes and far further than I thought, especially that crash we saw 2 weeks back.
We will adjust and track it as usual, and look to the smaller time frames to confirm or negate ideas, but for now, we are looking lower, it may even truncate, as that happens sometimes if the 3rd wave is huge, like this current move appears to be.
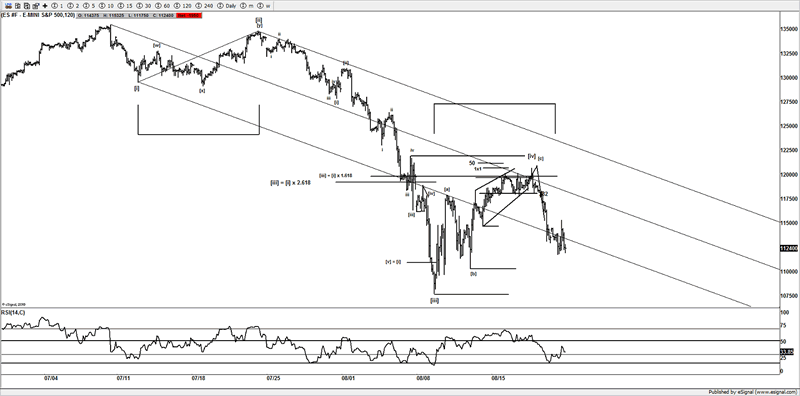
4th waves are notorious for a variation of patterns, whilst this has indeed been very impulsive decline (which is suspected as 5th wave) there is always the chance we could see some variation of a 4th wave, such as a flat or triangle, whilst I think the high point is in for the 4th wave idea, we do have areas above that as long as those are respected, we can look lower, and 30 handle bounces are fine by us, as they just offer us the chance to load up and add to shorts again, like we saw on Friday.
Fridays rally was strong, but I mentioned to members that we could look to sell again around 47-50ES, the high went a little bit higher, but once back under 47ES, we used 47ES as our risk point and sold it again into the close on Friday.
That sort of information really can only be traded in real time, as putting in 30 handle swings, is a traders paradise, and if you adjust your account size and stops to the market conditions, you can ride the swings the market is making.
I suspect many are getting hurt very badly, likely because they are positioning their account in the wrong manor, you simply have to allow for the conditions you are seeing and widen your stops and trade smaller, this is why we rely on Elliott Wave, as we can adjust our size for the moves and trade the larger swings.
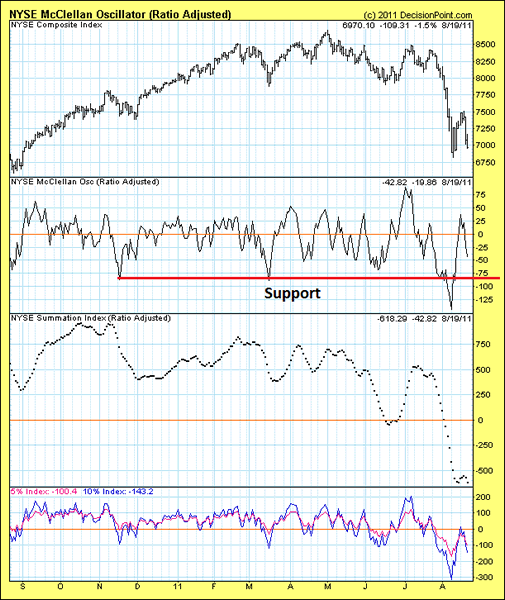
NYSE McClellan Oscillator
With the crash that we saw over the past few weeks, it's hard enough to even begin to suggest that there is going a test of the low we saw under -125. So baring a 1987 type event, if prices push towards the 1080-60SPX area I suspect we see a divergence in the NYSE McOsc, that would help confirm a low in place, and with the RSI having potentially reached its low, those can be clues to the trend reaching its saturation point, and a wash out, before a larger bounce should setup, likely right at the time the media starts with the headlines about confirmed bear markets, which I suspect will be the precise time you don't want to be getting short, right at the lows, and after a 5 wave sequence.
TYX VS SPX
Earlier in this article I mentioned a few tricks that I used to confirm that I thought this was a 4th wave. One of those tricks was a chart I have used for a long time, and it's been a great edge for us, and helps to confirm or negate reversals, it's not perfect, but it's worth its weight in gold if you can use the information, coupled with knowing what price is doing around your targets with patterns etc.
I wrote about it in last week's article Stock Market Setting Up For the Next Decline
You see trading this sort of market needs a skilled technician to get a few edges against the majority of traders and help build a picture to what the market is doing.
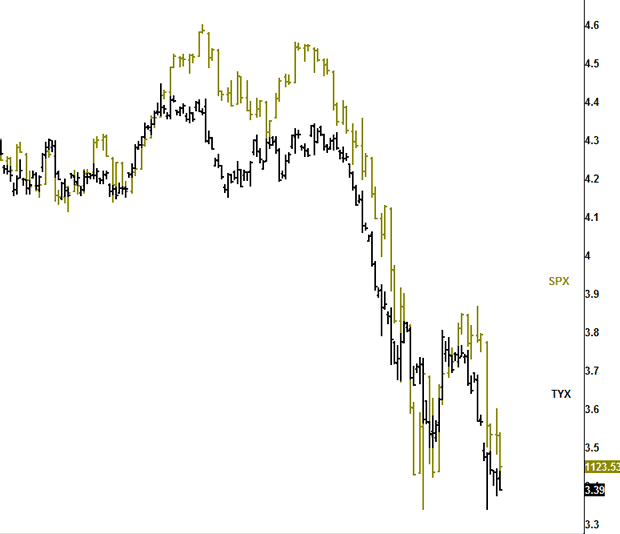
I posted this chart to members earlier in the week, and even posted it on my twitter channel, right about the time the market was making those minor new highs around 1200ES, and then reversing, what was happening in the market was not being confirmed via the TYX (30 year bond yields), so in order for that rally to be the "real deal" bonds needed to be sold off, what was happening is that traders were running back into bonds and not trusting the rally in stocks.
How did I know this??
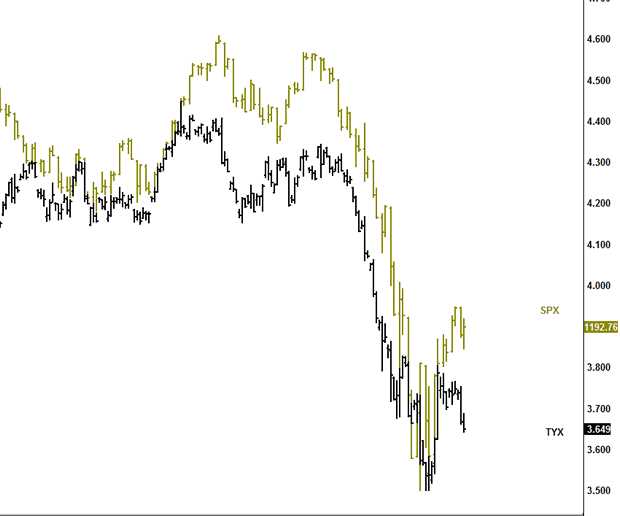
Look at the spread between the SPX Vs TYX, do you notice something?
Now look at what happens when stocks get ahead of themselves.
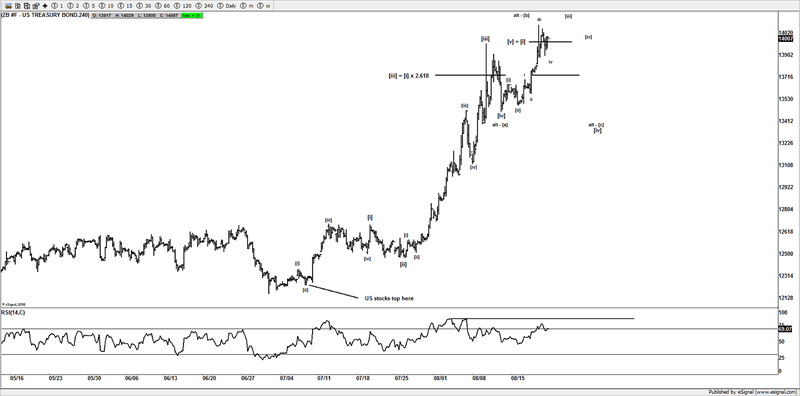
ZB (30 year bond)
A clue that I suspect could help stocks is what happens to bonds, as bonds still look unfinished, so if we are expecting a 5 wave decline in stocks, then what is ZB looking like?
I have been monitoring an idea for a while, and it appears it might just offer traders that are contrarians and able to focus of what price is telling you a huge edge.
So follow what price is suggesting, and not what the TV is suggesting. The TV tells you what has already happened, what we want to know is what is likely going to happen next. So we can setup ideas and trade those.
As you can see from this chart there appears to be a great looking like 5 wave advance in progress, so if bonds need to finish the final gyrations higher, then stocks should see the final gyrations lower. As anyone that has been around the markets for a while knows well the high correlation that stocks have with the long bond.
So again we can use our TYX VS SPX chart and maybe even find clues that traders move back into stocks just before a important low in stocks as bonds will need to be sold 1st before stocks can find any meaningful low, as unless you have these sorts of edges you really can't stay on the right side of these markets. The clues are there, it just needs an experienced technician to put the pieces together
Silver
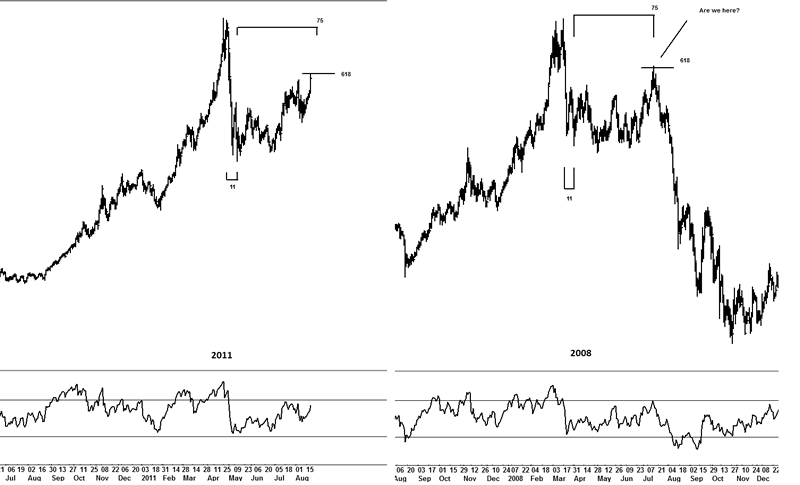
I found this interesting, and maybe a clue that silver traders especially the bulls maybe want to take note off, whilst analogues come and go, sometimes them work out other times they don't, this one I did find interesting.
We are on day 69 as of Fridays close, and the time window is nearing, and we have also hit the 618 retrace, so imo bulls on silver should take some care and attention from these levels, as looking at gold, I have every reason to think, that if gold sees a sell off and bonds follow, as risk is bought once again and traders move back into stocks, then I suspect we can see a heavy hit on the precious metals complex.
Put it like this, I like to buy stuff that is cheaper than it was a month or year ago, with gold going into parabolic type trajectories this past week, gold or silver is not a market I think offers "more bang for the buck".
I could be very wrong, and it would not be the 1st or last time I have been wrong on the markets, but I also look for opportunities that offer better reward/risk setup, and imo the metals are not the markets to be buying at these levels, simply because of where bonds and where gold is sitting, and also with reference to the ideas on stocks.
Recent addition to the website
I have had a few emails requesting to see some of my work closer up, and want to view some of my before and after shots, so I have created a section on the forum where potential members that are thinking of joining can come and view some of the ideas that members have the opportunity to trade going into the prior week. I will update this section periodically over time.
You can find those ideas here http://www.wavepatterntraders.com/index.php?/forum/179-before-after/
Conclusion
So far the markets are working the ideas that I previously mentioned, so continue to look lower, but from these levels going into next week, we will be watching price as it unfolds, and carefully looking to build a picture. I still suspect lower but as always the market is in control of its own destiny and we will respect the moves it makes.
Until next time.
Have a profitable week ahead.
Click here to become a member
You can also follow us on twitter
What do we offer?
Short and long term analysis on US and European markets, various major FX pairs, commodities from Gold and silver to markets like natural gas.
Daily analysis on where I think the market is going with key support and resistance areas, we move and adjust as the market adjusts.
A chat room where members can discuss ideas with me or other members.
Members get to know who is moving the markets in the S&P pits*
*I have permission to post comments from the audio I hear from the S&P pits.
If you looking for quality analysis from someone that actually looks at multiple charts and works hard at providing members information to stay on the right side of the trends and making $$$, why not give the site a trial.
If any of the readers want to see this article in a PDF format.
Please send an e-mail to Enquires@wavepatterntraders.com
Please put in the header PDF, or make it known that you want to be added to the mailing list for any future articles.
Or if you have any questions about becoming a member, please use the email address above.
If you like what you see, or want to see more of my work, then please sign up for the 4 week trial.
This article is just a small portion of the markets I follow.
I cover many markets, from FX to US equities, right the way through to commodities.
If I have the data I am more than willing to offer requests to members.
Currently new members can sign up for a 4 week free trial to test drive the site, and see if my work can help in your trading and if it meets your requirements.
If you don't like what you see, then drop me an email within the 1st 4 weeks from when you join, and ask for a no questions refund.
You simply have nothing to lose.
By Jason Soni AKA Nouf
© 2011 Copyright Jason Soni AKA Nouf - All Rights Reserved
Disclaimer: The above is a matter of opinion provided for general information purposes only and is not intended as investment advice. Information and analysis above are derived from sources and utilising methods believed to be reliable, but we cannot accept responsibility for any losses you may incur as a result of this analysis. Individuals should consult with their personal financial advisors.
© 2005-2022 http://www.MarketOracle.co.uk - The Market Oracle is a FREE Daily Financial Markets Analysis & Forecasting online publication.