


Stock Market Meltdown, Bear Market Remains Probable
Stock-Markets / Stock Markets 2011 Sep 11, 2011 - 07:24 AM GMTBy: Tony_Caldaro

 The week started off with a meltdown in Europe. They lost 4.35% on monday while the US markets were closed. When the US market opened on tuesday, it gapped down losing about 3%, made the low for the week, rallied nearly 6% from that low, then ended the week with another meltdown in Europe (-3.20%) closing about 1% above the low for the week. Economic reports for the week were sparse with positives edging out negatives four to three.
On the plus side: ISM services, consumer credit, the trade deficit and wholesale inventories all improved. On the negative: weekly jobless claims rose, and both the monetary base and the WLEI declined. For the week the SPX/DOW were -1.95%, and the NDX/NAZ were -0.35%. Asian markets lost 2.4%, Europe was -3.9%, the Commodity equity group slid 1.8%, and the DJ World index lost 3.3%. This week we have a plethora of economic reports and it’s Options expiration week.
LONG TERM: bear market highly probable
We have been posting every day, for some time now, “bear market highly probable”. What this means is that we suspect we are in a bear market, by the wave patterns, but it has not yet been confirmed by OEW’s quantitative analysis. The March 2009 to May/July 2011 bull market unfolded in five quantified waves. This is quite clear. We have counted these waves as five Primary waves, expecting this first bull market off the Mar09 Supercycle low to be of a Cycle wave degree. Historically Cycle waves can last anywhere from one (1973-1974) to thirty-three years (1974-2007). The shorter ones are typically bear markets, and the longer ones bull markets.
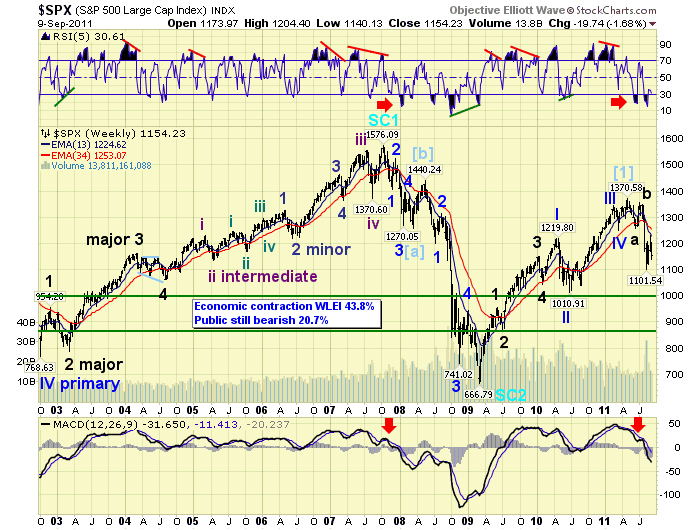
The recent two year bull market we have currently labeled Cycle wave [1]. It should be followed by a Cycle wave [2] bear market which could end anywhere between 2012 and 2016. We are currently expecting either 2012 or 2014. Both are tech cycle low years, and 2014 is a 4-year presidential cycle low year. Fibonacci relationships suggest a potential low at three specific areas: 38.2% retracement at SPX 1102, (which we already hit exactly); 50.0% retracement at SPX 1018, (which is within a few points of the Primary wave II 1011 low); and 61.8% retracement at SPX 935. Currently we are targeting the Primary wave II low area. We’ll see how the market looks, technically, as it approaches.
MEDIUM TERM: downtrend may have bottomed at SPX 1102
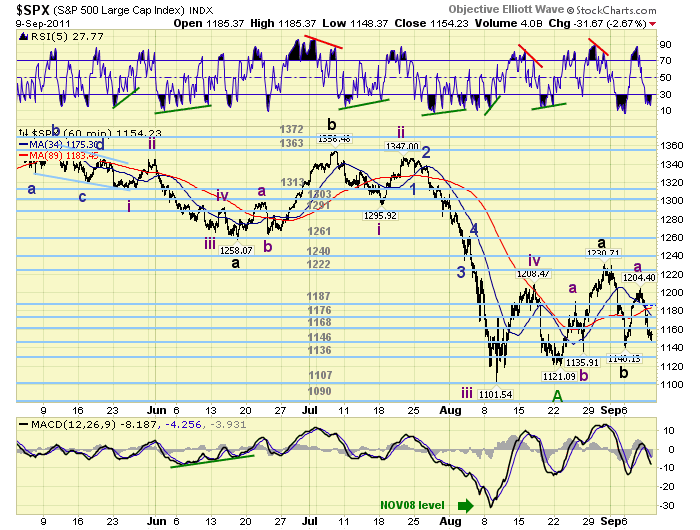
The current downtrend, OEW has not confirmed an uptrend yet, started in early July at SPX 1356. We counted three Intermediate waves down into the early August SPX 1102 low, then a potential 4th wave at SPX 1208 in mid-August, and a potential 5th wave failure at SPX 1121 to end Major wave C. We then expected an abA-B-abC wave uptrend lasting about two months. Thus far the market has followed that scenario.
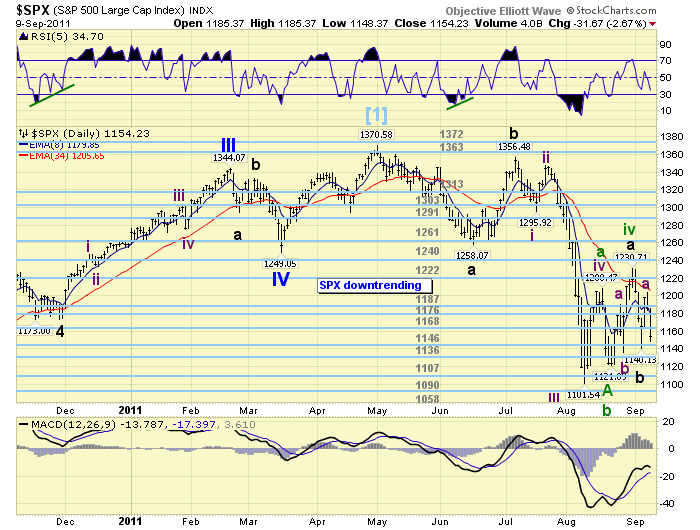
The abA wave unfolded with a rally to SPX 1191, a pullback to 1136, and then a rally to 1231. The B wave followed with a decline to SPX 1140. Now the ab of the abC appear to be unfolding with a rally to SPX 1204, then a pullback to friday’s 1148 low. What should follow next is a rally to a higher high than SPX 1231. We’re sticking with this scenario but we do see a potential problem.
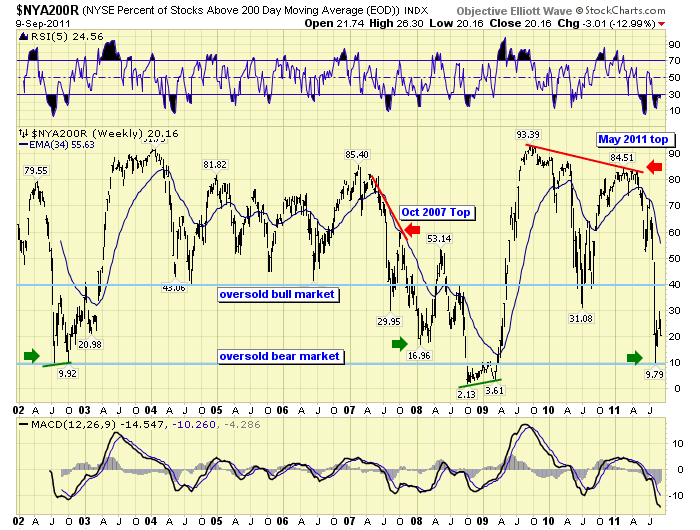
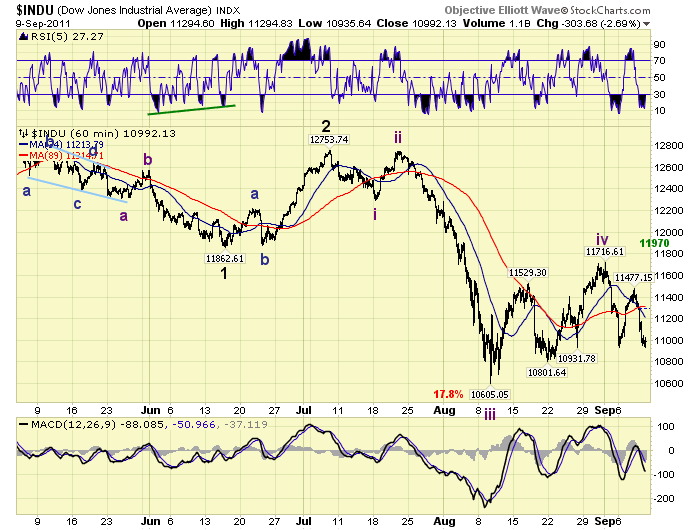
Typically during this type of wave setup the market internals should improve dramatically. At the lows the percentage of stocks above their 200 dma dropped to 10%. This signalled an extremely oversold condition even for a bear market. Since that low the percentage had risen to 30%, then dropped recently to 20%. We would have expected a more significant improvement in the area of 40% to 50% during this type of wave setup. Thus far it has not occurred. Should the market internals continue to deteriorate it would indicate that the recent rally from 1102/1121 is not the beginning of an uptrend, but an Intermediate wave iv with Intermediate wave v underway now. We have posted this alternate count on the DOW charts. The next fews days of trading should clear up this situation.
SHORT TERM
Support for the SPX is at 1146 and then 1136, with resistance at 1168 and then 1176. Short term momentum is quite oversold. When we review the wave activity since the SPX 1121 low we find the waves to be quite similar. The length of the waves in the abA were: 70 – 55 – 95. Then after the B wave, the length of the abC have been: 64 – 56.
Should the recent SPX 1148 low fail to hold, and the OEW 1146 pivot fail to hold as well, then the similarity would have been broken and the alternate DOW count would come into play. This would suggest that Intermediate wave iv topped at 1231, and the market is now in a Minor 1-2-3 down of Intermediate wave v. Should the 1146 pivot hold support the market would have to rally above the 1176 pivot to turn the short term OEW charts positive again, and the C of the abC would be underway. Since the market closed at SPX 1154 on friday we should know soon either way. Best to your trading!
FOREIGN MARKETS
The Asian markets were mostly lower on the week for a net loss of 2.4%. India’s BSE was the only gainer.
The European markets were also mostly lower losing 3.9%. Switzerland’s SMI gained 1.3%.
The Commodity equity group were all lower for a net loss of 1.8%.
The DJ World index lost 3.3% on the week, and remains in a downtrend along with all the world’s indices.
COMMODITIES
Bonds lost 0.2% on the week but remain in an uptrend as 10YR rates made a new record low at 1.90%. The 30YR yield ticked down to 3.19%.
Crude gained 0.4% on the week in what appears to be a choppy uptrend.
Gold has been quite volatile lately losing 1.4% on the week. We expected it to correct but this uptrend has been quite resilient. Silver, which has been lagging, lost 4.2% on the week.
The USD continued its uptrend in earnest this week gaining 3.3%. The downtrending EUR lost 3.9%, and the JPY lost 0.9%. The bullish 17-year Supercycle in the foreign currencies appears to have rolled over.
NEXT WEEK
Tuesday kicks off a busy economic week with Import/Export prices and the Budget deficit. Then wednesday we have the PPI, Retail sales and Business inventories. On thursday the weekly Jobless claims, the CPI, the NY and Phily FED, and Industrial production. Then on friday Consumer sentiment and Options expiration. The FED has two speeches scheduled, at their headquarters, on thursday. First chairman Bernanke in the morning, and then FED governor Tarullo in the afternoon. The next FOMC meeting in on September 20th and 21st. Also, the G 7 is meeting this weekend. Best to your weekend and week!
CHARTS: http://stockcharts.com/...
http://caldaroew.spaces.live.com
After about 40 years of investing in the markets one learns that the markets are constantly changing, not only in price, but in what drives the markets. In the 1960s, the Nifty Fifty were the leaders of the stock market. In the 1970s, stock selection using Technical Analysis was important, as the market stayed with a trading range for the entire decade. In the 1980s, the market finally broke out of it doldrums, as the DOW broke through 1100 in 1982, and launched the greatest bull market on record.
Sharing is an important aspect of a life. Over 100 people have joined our group, from all walks of life, covering twenty three countries across the globe. It's been the most fun I have ever had in the market. Sharing uncommon knowledge, with investors. In hope of aiding them in finding their financial independence.
Copyright © 2011 Tony Caldaro - All Rights Reserved Disclaimer: The above is a matter of opinion provided for general information purposes only and is not intended as investment advice. Information and analysis above are derived from sources and utilising methods believed to be reliable, but we cannot accept responsibility for any losses you may incur as a result of this analysis. Individuals should consult with their personal financial advisors.
© 2005-2022 http://www.MarketOracle.co.uk - The Market Oracle is a FREE Daily Financial Markets Analysis & Forecasting online publication.