


Understanding Fibonacci, Learn to Apply Ratios to Calculate Stock Price Targets
InvestorEducation / Learn to Trade Oct 07, 2011 - 04:20 PM GMTBy: EWI

 The Fibonacci ratio can be an invaluable tool for calculating price retracements and projections in your analysis and trading. This excerpt from The Best Technical Indicators for Successful Trading explains the origins of the Fibonacci sequence and how you can apply it to the markets.
You can read the entire Fibonacci section -- plus 7 more lessons on how to use technical indicators to improve your trading for FREE -- see below.
Leonardo Fibonacci da Pisa was a thirteenth-century mathematician who posed a question: How many pairs of rabbits placed in an enclosed area can be produced in a single year from one pair of rabbits, if each gives birth to a new pair each month starting with the second month? The answer: 144. The genius of this simple little question is not found in the answer, but in the pattern of numbers that leads to the answer: 1, 1, 2, 3, 5, 8, 13, 21, 34, 55, 89, and 144. This sequence of numbers represents the propagation of rabbits during the 12-month period and is referred to as the Fibonacci sequence.
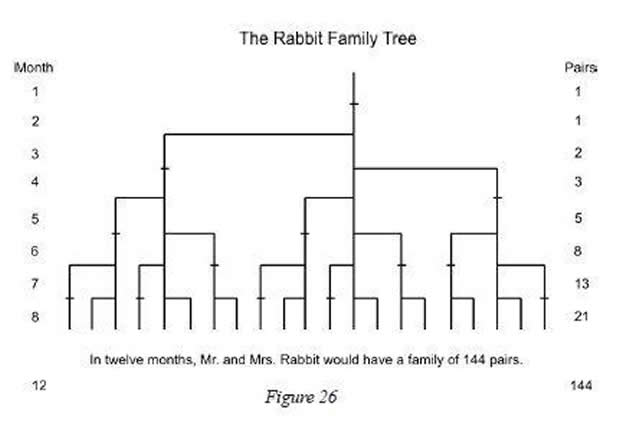
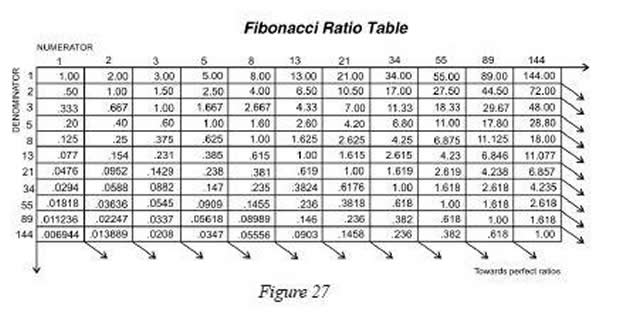
The ratio between consecutive numbers in this set approaches the popular .618 and 1.618, the Fibonacci ratio and its inverse. (Relating non-consecutive numbers in the set yields other popular ratios - .146, .236, .382, .618, 1.000, 1.618, 2.618, 4.236, 6.854....)
...In addition to recognizing that the stock market undulates in repetitive patterns, R. N. Elliott also realized the importance of the Fibonacci ratio. In Elliott's final book, Nature's Law, he specifically referred to the Fibonacci sequence as the mathematical basis for the Wave Principle. Thanks to his discoveries, we use the Fibonacci ratio in calculating wave retracements and projections today.
How to Identify Fibonacci Retracements
The primary Fibonacci ratios that I use in identifying wave retracements are .236, .382, .500, .618 and .786. Some of you might say that .500 and .786 are not Fibonacci ratios; well, it's all in the math. If you divide the second month of Leonardo's rabbit example by the third month, the answer is .500, 1 divided by 2; .786 is simply the square root of .618.
There are many different Fibonacci ratios used to determine retracement levels. The most common are .382 and .618. However, .472, .764 and .707 are also popular choices. The decision to use a certain level is a personal choice. What you continue to use will be determined by the markets.
...It's worth noting that Fibonacci retracements can be used on any time frame to identify potential reversal points. An important aspect to remember is that a Fibonacci retracement of a previous wave on a weekly chart is more significant than what you would find on a 60-minute chart.
See charts that show the application of Fibonacci ratios, plus 7 other lessons on technical indicators, by accessing your free report now.
|
This article was syndicated by Elliott Wave International and was originally published under the headline Understanding Fibonacci. EWI is the world's largest market forecasting firm. Its staff of full-time analysts led by Chartered Market Technician Robert Prechter provides 24-hour-a-day market analysis to institutional and private investors around the world.
About the Publisher, Elliott Wave International Founded in 1979 by Robert R. Prechter Jr., Elliott Wave International (EWI) is the world's largest market forecasting firm. Its staff of full-time analysts provides 24-hour-a-day market analysis to institutional and private around the world.
© 2005-2022 http://www.MarketOracle.co.uk - The Market Oracle is a FREE Daily Financial Markets Analysis & Forecasting online publication.