


Stock Market Poised For A Sharp Pullback Near Term says Dr Copper
Stock-Markets / Stock Markets 2011 Oct 21, 2011 - 12:59 AM GMTBy: David_Banister

 Back on October 3rd I wrote a public article forecasting a major market bottom at around 1088 on the SP 500 index. I surmised we were about to complete a 5 wave move to the downside that commenced with the Bin Laden highs of 1370 in early May of this year. The following day we bottomed at 1074 intra-day and closed over my 1088 pivot and continued higher as we all know. That brings us to the recent highs of 1233 intra-day this week, a strong 159 point rally off the 1074 lows in just a few weeks.
Markets I contend move based on human behavioral patterns, mostly because the crowd reacts to good or bad news in different ways depending on the collective psychology of the masses. There are times when seemingly bad news is ignored and the markets keep going higher, and there are times when very good news is also ignored and the markets go lower. This is why I largely ignore the day to day economic headlines and talking heads on CNBC, as they are not much help in forecasting markets at all.
Using my methods, I was able to forecast the top in Gold from 1862-1907 while everyone was screaming to buy. I was able to forecast the April 2010 top in the SP 500 well in advance, the bottom last summer, and recent pivot tops at 1231 and 1220 amongst others. All of this is done using crowd behavioral theory and a bit of my own recipes. That brings us forward to this recent rally from 1074 to 1233, which as it turns out is not all that random.
The rally to 1233 will have taken place within a 13 Fibonacci trading day window which ends today. In addition, the rally is leading into the end of Options Expiration week which tends to mark pivot highs and pivot lows nearly every single month. Also, at 1233 we have a 61% Fibonacci retracement level of the 1010 lows of July 2010 and the 1370 highs of May 2011. 1233 was my “Bear line in the sand” I gave out a few months ago to my subscribers as a likely bull back breaker. In essence, the market is having trouble breaking the glass ceiling at 1233 for a reason; it’s a psychological barrier for investors now.
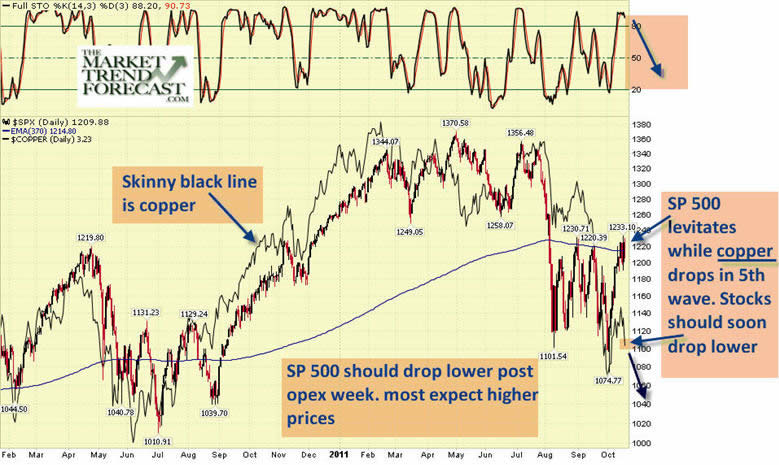
Near term, I expect the market to have another sharp correction to work off the near 160 point SP 500 rally that has taken hold in just over two weeks and again on 13 Fibonacci trading days as of today. In addition to that, we should follow copper as it tends to be an extremely good indicator for the SP 500 index long and short term.
Right now, Copper has dropped 8% this week while the SP 500 levitates on a magic carpet ride within a 30 point range. Copper looks like it has begun a 5th wave down, which will likely take it to the $2.70’s per pound from $3.46 last week on its recent bounce from $2.99. Below I offer a few charts showing the projected copper pattern and also one showing the SP 500 relating to Copper.
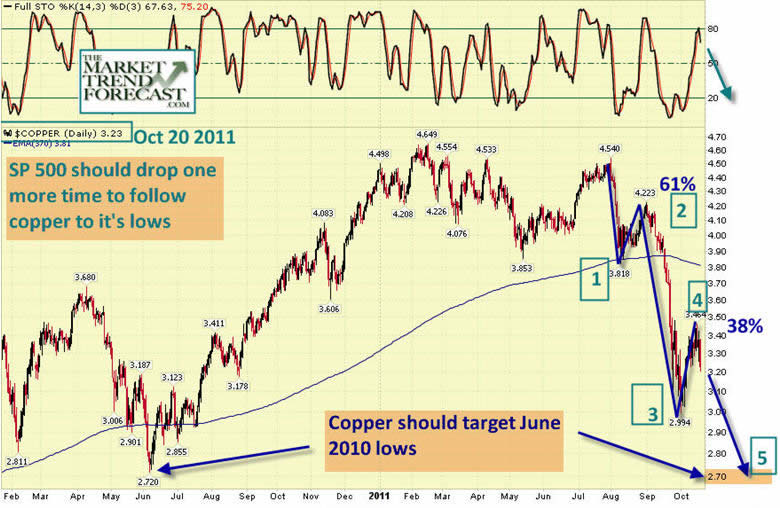
In any event, we are due for what I call a “B wave” correction of sentiment in the SP 500 and market indices, which should take the SP 500 to the 1149-1167 ranges minimally, and perhaps set up another entry for a C wave to the upside. Caution is warranted near term is my point. If you’d like to receive these types of regular updates during the week covering Gold, Silver, and SP 500 and more, check us out for a coupon or free weekly update at www.MarketTrendForecast.com
Dave Banister
CIO-Founder
Active Trading Partners, LLC
www.ActiveTradingPartners.com
TheMarketTrendForecast.com
Dave Banister is the Chief Investment Strategist and commentator for ActiveTradingPartners.com. David has written numerous market forecast articles on various sites (SafeHaven.Com, 321Gold.com, Gold-Eagle.com, TheStreet.Com etc. ) that have proven to be extremely accurate at major junctures.
© 2011 Copyright Dave Banister- All Rights Reserved
Disclaimer: The above is a matter of opinion provided for general information purposes only and is not intended as investment advice. Information and analysis above are derived from sources and utilising methods believed to be reliable, but we cannot accept responsibility for any losses you may incur as a result of this analysis. Individuals should consult with their personal financial advisor.
© 2005-2022 http://www.MarketOracle.co.uk - The Market Oracle is a FREE Daily Financial Markets Analysis & Forecasting online publication.