


Stock Market Broadening Top
Stock-Markets / Stock Markets 2011 Oct 24, 2011 - 04:24 AM GMT

 -- The VIX has signaled a potential change in the daily trend last week. Having made its Master Cycle low, it spent the week making a reversal pattern that implies an explosive rally is in the offing. A break in the upper trendline of the Broadening Bottom formation near 55.00 calls for an average gain of 25% above the trendline. A cross of intermediate-term Resistance at 35.87 gives us a buy signal in the VIX.
-- The /SPX formed a new Broadening Wedge formation visible in the hourly and daily charts. . They are pre-crash formations. This pattern suggests an average 20% decline from the lower trendline at 1200, once it is crossed. This gives us an immediate target of 960 over the next two weeks. Another way of looking at this pattern is a sideways consolidation (flag), which implies the next move will be in the same direction and the same magnitude as the first. Using the original wave construction, this yields a target of 983. Using the alternate scenario, the target becomes 942.00..
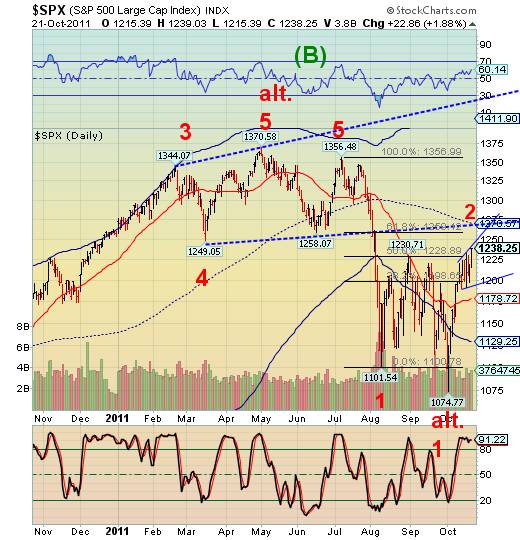
The next Cycle turn date is Tuesday, so we may have to see yet one more flush of borrowed liquidity in the markets on Monday. There is a saying, “Liquidity turns coward when you need it the most!”
-- The Euro hit its head against neckline resistance at 139.00 twice last week, to no avail. While it is possible that the Euro may make a false break above the neckline on Monday, its turn date is also on Tuesday
Although the news for public consumption is upbeat, the Europeans are no closer to a solution than they were two months ago. ZeroHedge reports nine meetings within a five day span, with more to come. The funny part is that they are still only dealing with the problems of Greece. What about Italy, with the second largest debt in Europe, at $2.2 trillion and no solution in sight.
-- The dollar has made a near-perfect 50% retracement from its first impulse high off the May 4 low of 72.70. I had suggested last week that, “The retracement appears complete, although it may search for the bottom at 76.27, its 50% retracement.” Having missed the prior turn date, the new turn date happens to be Sunday, October 23rd. A rally above the Intermediate term Trend Resistance at 77.46 and the upper trendline of its Broadening Bottom formation .may send the US Dollar into the mid-90’s in very short order. The inverted Head & Shoulders pattern adds confirmation and impetus to the move.
-- Gold confirmed its cycle high and a 416% retracement high last Monday, October 17. Since then, it has tested the lower trendline of its Orthodox Broadening Top. The cycle pattern suggests a possible low at the end of October after breaking the trendline. But more likely, a significant low may be in the works for late November, where its Orthodox Broadening Top target may be reached.
The cycles suggest a significant low for gold in 2012. If it can remain above 750 at its 2012 low, the secular uptrend in gold may continue. However, should gold decline below 750, there may be yet another four years of decline in gold.
-- This week USB held its uptrend. That signals waning selling pressure in bonds while equities continued to rally. This has given me the temerity to put an Elliott Wave count on USB that implies one more (blow-off) rally to come in bonds. I did a little history checking in the long bond and verified that the all-time peak in 30-year yields was October, 1981. Should the rally continue, the cycles suggest the all-time low in yields and top in bonds may be near the last week of November.
--West Texas Crude appears to have made its right shoulder high last Tuesday, October 18. I expect to see some follow-through to the downside right at the open on Monday with intermediate-term Trend Support at 85.26 giving way. .
Those of you following my work may remember that the initial Broadening Wedge formation anticipated a possible low near 74.00. The August low was a near miss. The new broadening flag formation anticipates a low near 57.75. I would not ignore that warning.
Some of you may have read my blog, entitled, “What’s with China?” I have kept quiet for the past few weeks, since the Shanghai Index has been hovering near its low since then. However, this Wednesday, October 26, may mark the index’s Master Cycle low and the 2011 Yearly Cycle low for the Shanghai index, as well. The pattern in the charts is a “flat correction,” much the same as what we are seeing in the equties indexes, but two years instead of two months, and bullish vs bearish in Domestic equities. A bullish cross above intermediate term Trend Resistance at 2447.27would be the first hurdle in recognizing a change of trend.
Considering that the long bond is nearing the end of its trend and “hot money” having few other choices than the US Dollar, wouldn’t it be interesting to see the beginning of a new trend in China?
Good Luck and good trading!
Regards,
Tony
Our Investment Advisor Registration is on the Web
We are in the process of updating our website at www.thepracticalinvestor.com to have more information on our services. Log on and click on Advisor Registration to get more details.
If you are a client or wish to become one, please make an appointment to discuss our investment strategies by calling Connie or Tony at (517) 699-1554, ext 10 or 11. Or e-mail us at tpi@thepracticalinvestor.com .
Anthony M. Cherniawski, President and CIO http://www.thepracticalinvestor.com
As a State Registered Investment Advisor, The Practical Investor (TPI) manages private client investment portfolios using a proprietary investment strategy created by Chief Investment Officer Tony Cherniawski. Throughout 2000-01, when many investors felt the pain of double digit market losses, TPI successfully navigated the choppy investment waters, creating a profit for our private investment clients. With a focus on preserving assets and capitalizing on opportunities, TPI clients benefited greatly from the TPI strategies, allowing them to stay on track with their life goals
Disclaimer: The content in this article is written for educational and informational purposes only. There is no offer or recommendation to buy or sell any security and no information contained here should be interpreted or construed as investment advice. Do you own due diligence as the information in this article is the opinion of Anthony M. Cherniawski and subject to change without notice.
Anthony M. Cherniawski Archive |
© 2005-2022 http://www.MarketOracle.co.uk - The Market Oracle is a FREE Daily Financial Markets Analysis & Forecasting online publication.