


Gold as a Positive Economic Indicator
Commodities / Gold and Silver 2011 Nov 15, 2011 - 05:07 AM GMTBy: The_Gold_Report

 A $3,000/ounce gold spike could boost equity valuation. In this exclusive interview with The Gold Report, John Kaiser, editor of Kaiser Research Online, shares the catalysts that could propel gold and silver stock prices higher in 2012.
The Gold Report: Gold prices reached historic highs during the last quarter. However, in a recent Kaiser Bottom-Fish newsletter, you showed the Toronto Stock Exchange Venture (TSX.V) listings since February have had dramatically more down than up days. Is this a correction or a long-term trend?
John Kaiser: What we have seen is a negative response by ordinary investors to a deteriorating economic outlook for the United States and the world, which we might call a correction of expectations. But what worries me about a long-term trend is the growing prevalence of volatility-based profit harvesting, high-frequency and algorithmic trading paired with the elimination of the downtick rule for short selling, which allows traders to push markets down or up at will and in the process destroy perceptions of value in the market. This has been particularly intense in the junior resource sector, which the TSX.V is dominated by, because these companies, generally, do not have revenues and cash flow, the usual measures by which value is assigned.
It is very difficult to develop a visualization of what a venture project is all about, what it could become and turn that into a market valuation that enables the company to finance its projects at minimal dilution to existing shareholders. It is much easier to pound the order book, fill it with sells and completely undermine the perception of the people who have been investing for value. The bottom line is that we have seen a withdrawal of value-style investors from this market, both at the retail and sophisticated levels. As an example of how significant this has been, during February, the Venture Exchange averaged $310 million (M) worth of trading per day. By October, the average value traded had plunged to $94M per day.
TGR: Are you saying that the difference is not because of the fundamentals of the stocks and the companies behind them that are on the TSX.V, but because the rules have changed and people are playing around the volatility?
JK: It is a combination of the two. We had a surprise recovery in the resource sector in 2009 and 2010, facilitated by U.S. quantitative easing and China's stimulus program that injected $600 billion into infrastructure development. Coupled with strategic Chinese stockpiling, that helped pull up raw material prices from the end-of-2008 lows. But the Fukushima nuclear disaster with its supply chain interruptions and the emergence of the Tea Party as a major force in the debt ceiling debate conspired to make the world very concerned that the creeping recovery is going to tip back into the garbage can. That has stalled the post-crash recovery in raw material prices, leading investors to price in the possibility of the global economy descending into a 1930s-style depression. Contrary to the beliefs of many goldbugs, a depression would also be negative for gold and silver prices.
TGR: In addition to some of these short-term trends, you have talked about the possibility that the United States is moving away from its power position. Europe and America are descending while China and India are ascending. Do most people see this? And is this impacting the stock market?
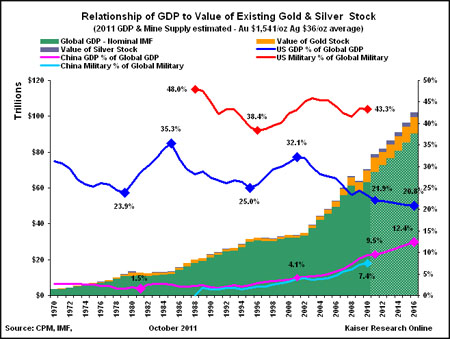
JK: The "declinist view" says that the U.S. economy and its military power are in a long-term downtrend. In at least economic terms, this is supported by gross domestic product (GDP) statistics. In 2000, the U.S. GDP was 32% of global GDP while China's was about 5%. Since then, American GDP has sunk to about 22% while China's sits at just under 10%. At the same time, we have seen America's share of total military expenditures rise from about 40% to 43%, where it seems to be going sideways. The U.S. is carrying an unsustainable burden of the cost of keeping the global peace. With America's share of global GDP in long-term decline, the ability to fund almost single-handedly a global military force is not sustainable.
TGR: Based on that, what is your prediction for the final quarter of 2011?
JK: What I have described is a long-term trend that is underway. Right now, we are in the throes of sorting out what is going on with the Eurozone. Europe is in danger of imploding upon itself. It needs to stabilize its financial situation. At the same time, we need to see some signs that the American economy is rebounding. Employment statistics are going to be important. After losing nearly 6 million manufacturing jobs between 2001 and the end of 2009, some 303,000 manufacturing jobs have been created since 2010. This trend stalled earlier this year because of the Japanese supply chain disruption and concern that the political quagmire will result in consumer demand destruction. We need manufacturing capacity to come back to the U.S. in order to support the growing service job economy. The uncertainty about the growth of real jobs could result in a very volatile market during the last couple months of this year.
Wall Street sees down as easier than up, so the tendency is to lean on the market and pressure it down. A big tax loss selling window is going to emerge soon. We may even see a bottom-fishing window open up. My concern is that shareholders who understand why they own quality stocks will be reluctant to sell at the bottom after enduring what amounted to a nearly yearlong slow motion crash. On the other hand, low quality stocks will probably be sold ruthlessly. That means poor liquidity in the better stocks, but very high liquidity at very cheap prices in the stocks that do not have staying power. We may, in fact, see an icicle-type formation where prices dip down because there has been lots of selling into the bids without significant replacement by new bids. Too many investors remember how unwise it was to catch half-price bargains in the fall of 2008 that turned out be falling knives and anvils. When people finally go looking for quality stocks at depressed prices this December, they will find little available. As they start to reach for stocks, prices will spike upward and kick off Q112 with a strong uptrend.
TGR: In an environment like this, what is the best way for an investor to protect wealth or maybe even profit?
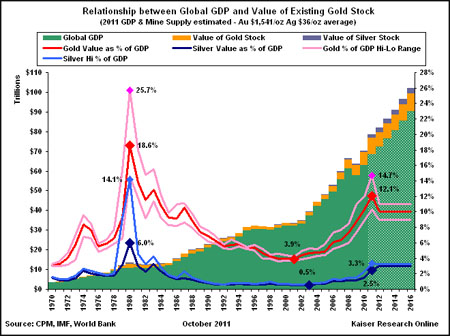
JK: My area of specialty is the resource sector, both the mining companies and the resource exploration and development companies. If you accept my belief that the strength in gold and silver prices reflect anxiety about the relative decline of the United States as both an economic and military power, which I see manifested in the fact that the value of all the aboveground gold and silver has risen to 12% and 3% of global GDP, respectively, from the 4% and 0.5% levels that prevailed a decade ago when America was indisputably triumphant, we will see prices head modestly higher from current levels over the next five years.
That is very significant for the gold and resource producers and juniors because they are pricing a bubble-type perception, namely that gold is going to go back to $1,000/ounce (oz) and that silver is going to go back below $15/oz, prices that could make many of these companies unprofitable. That is the reason we are seeing very low cash-flow multiples similar to what we often see in industrial mineral-type companies. So the big bet here is that we will witness an inflection when people start to accept that the current gold and silver prices are the new reality, which will result in an upward repricing of anywhere from 100–300% for gold and silver companies.
One strategy is to look at the solid, cash flow-positive silver and gold producers right now, and take a position in them. A secondary strategy would be to look at the gold and silver ounce-in-the-ground development companies, which are trading at valuations considerably lower than what you get by plugging current metal prices into the discounted cash-flow valuation model.
TGR: What would be some examples of companies that fit either the cash-flow positive or the development company trading at a lower-valuation model?
JK: Fortuna Silver Mines Inc. (FVI:TSX; FSM:NYSE; FVI:Lima Exchange) has a mix of silver and base metal production. It would benefit considerably if people expect the current cash flow to be sustainable over the next few years.
TGR: It looks like it is trading at $6.58 right now. It has been as high as $7.22.
JK: Right now, Fortuna is being priced at roughly a very conservative six-times multiple of 2012 cash flow based on forecast production and the current $34/oz silver price. The reason it is so low is that people do not think the cash flow is sustainable. That can be either because they think a mine will encounter a problem and cease production or because they expect the commodity price to go down substantially.
So far, Fortuna has not disappointed us with production from Caylloma, but we do need to see production ramp up for San Jose to proceed next year as expected. But a lowish 5–7 multiple for next year's forecast production at current silver prices seems to be the norm for primary silver producers. To help my readers better understand the situation, I have created a couple of graphics based on our production and cash-flow forecast for Fortuna. The annual production and price target chart shows the impact San Jose coming on stream will have on silver production over the next four years. In 2012, San Jose will add 1.7–1.9 million ounces (Moz) from Caylloma, growing overall silver production to 5 Moz annually by 2015. The chart shows the stock price that would result at a 10 times cash-flow multiple at different average silver prices for 2012.
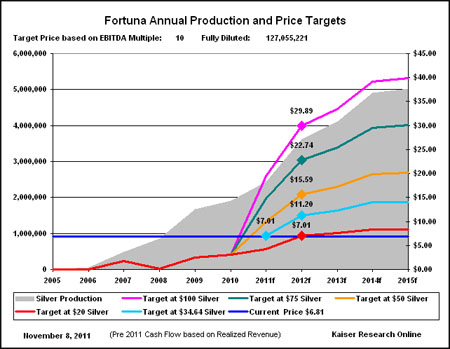
As you can see, the current $6.58 stock price is not far from the $7.01 price target that corresponds with a $20/oz silver price and a 10 times cash-flow multiple. But if we apply the current $34.64/oz silver price, the stock price jumps to $11.20 at a 10 times multiple. At $50/oz silver, the price target jumps to $15.59. You can also see what happens at more optimistic silver prices such as $75 and $100. A five times cash-flow multiple is too conservative for a precious metals producer such as Fortuna whose silver production at $20/oz silver is 60% of revenue.
Once there is acceptance that silver prices are not going back to the bad old days, you could see a 15:1-type multiple emerge. It is hard to predict what sort of cash-flow multiple the market will eventually settle on during these volatile times, but the second Fortuna chart helps me see the price target for Fortuna during 2012 at various average silver prices and cash-flow multiples.
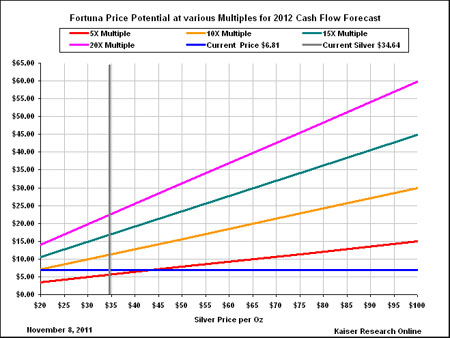
For example, suppose you think, like I do, that silver could average $50/oz in 2012 and silver producers attract a 15 times multiple. Slide that vertical silver bar reflecting the current silver price over to $50/oz, and move up to the green line corresponding with a 15 multiple and you get a price target just short of $25/share for Fortuna. It should be obvious that the market is biased toward a pessimistic scenario where silver crashes back to $20/oz. Keep in mind that this cash-flow-based valuation metric assumes that higher silver prices are not due to substantial cost inflation or U.S. dollar exchange rate declines, which would gobble up any gains in silver revenues caused by price increases.
The primary silver producers are companies that did all the heavy lifting in the past few years, putting their silver deposits into production. They are now getting an enormous amount of cash flow, but are not being priced as if this cash flow will be sustainable over the life of the mine. So, the big bet is whether current silver prices are sustainable over the next five years. I am arguing that they are sustainable and we will see a valuation paradigm shift where these low cash-flow multiples of 5:1 will jump up to a 10:1 or 15:1 ratio. What will follow is an aggressive development of more silver production absent the concern that capital expenditures will end up being lost because silver prices collapse.
TGR: Could a shift to 10:1 pricing boost all silver producers?
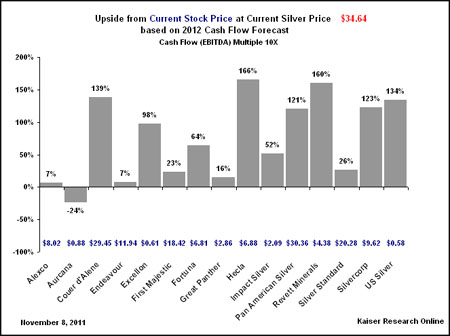
JK: If the silver price proves to be sustainable, we could see the stocks all undergo significant gains as they adjust to this new paradigm, as is evident in the Upside Potential chart for the 15 primary silver producers we track. The one apparent exception is Aurcana Corporation (AUN:TSX.V), which looks weak because in 2012 its Shafter mine will add only 900,000 silver ounces to the existing 1 Moz production from La Negra. But Shafter is forecast to hit 3 Moz in 2013, bringing total production to 4.8 Moz in 2015. So Aurcana might be the laggard to watch for those speculators who prefer to react to the inflection rather than anticipate it.
TGR: On the gold side, you pointed out in a recent article that the inflation-adjusted equivalent of the post-1980s bubble of $400/oz would be $1,032/oz and that $1,800/oz gold represents a 74% real gain. What are you predicting is going to be the new normal for gold?
JK: Much of the discussion about gold treats it as an inflation hedge. We can argue that the big move during the 1980s was a slingshot effect that allowed gold to catch up for decades of inflation while its dollar price was artificially fixed. Goldbugs today will argue that the "real price gain" I am observing is just an anticipation of the inflation that will come once the world's debt problems are monetized. If they are correct, then it explains why there is such muted interest in gold equities despite record gold prices. Whatever profits are present today will vanish tomorrow when costs undergo an inflation big bang. But I think there is a different reason for this "real price gain" to be present, and it is not bad for gold equities, at least not in the medium-term future.
Rather than relate the value of the existing gold stock to measures such as the money supply, I look at gold's value as a function of global GDP. Given that GDP represents the total value of exchanged goods and services whose turnover one can assume created wealth while gold just sits there growing incrementally while accomplishing very little, you might wonder what the connection would be between wealth creation and the value of the gold stock. This chart graphs the annual value of the aboveground gold stock based on the average annual gold price as a percentage of nominal global GDP expressed in U.S. dollars at the average currency exchange rates prevailing each year.
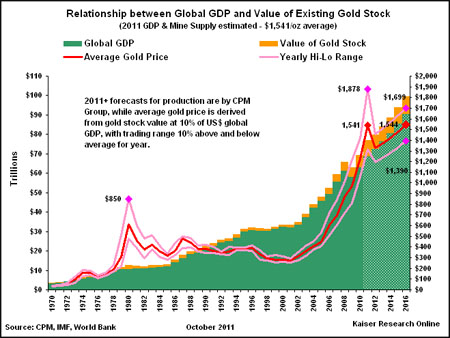
That description is a mouthful, but I find the graph fascinating because it shows a massive spike to an $850/oz gold peak of 26% in 1980 when it looked very much like America was losing it on the global stage, plunging to a low of 4% in 2001 when it looked like the world was America's oyster. Since then, we see a gradual increase to a peak of 15% in 2011, but still well short of the 1980 peak of 26%. We see a similar pattern with the aboveground silver stock.
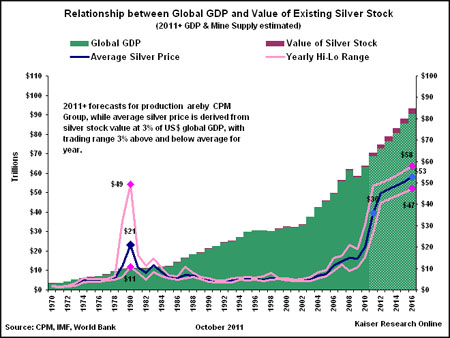
Note that during the past 30 years miners added 2.2 billion ounces (Boz) gold to the 3.2 Boz that existed in 1980, and 17 Boz silver to the 30 Boz that existed then. This graph includes the value of that additional gold and silver.
The possible meaning of this trend begins to take shape when we look at another chart that plots the American and Chinese GDP as a percentage of global GDP, along with plots of each nation's military expenditures as percentages of global military expenditures. America's GDP percentage has declined from 32% in 2000 to its current level of 22%, while China's has grown from 4% to nearly 10%. At the same time we see America's military spending stuck at about 43% of global spending, while China's share has nearly doubled to just over 7%, a trend that closely tracks the growth of its GDP. Given political efforts to contain government spending, and the fact that military spending is the single biggest item in the spending budget, an obvious question is what exactly does this overwhelmingly high percentage of global military spending accomplish, and do American taxpayers proportionately benefit? Regardless of the answer, what happens if these inversely related American and Chinese GDP percentage trends continue along their trajectories?
In my view, the expansion of the value of the aboveground gold and silver as percentages of global GDP reflect growing international uneasiness about the next two decades during which America and China respectively become relatively weaker and stronger on the global stage. The real price increases we have seen in gold and silver reflect this growing structural uncertainty rather than fear about hyper-inflation and fiat currency collapse. And short of a catastrophic global economic collapse that causes China to implode worse than the United States, I do not see anything on the horizon to make this anxiety diminish.
So let's assume that, rather than an escalation of anxiety such as we saw in 1980, we are stuck with persistent medium-level anxiety that, for argument's sake, stabilizes at a level where the value of the gold stock is 10% of GDP and in the case of silver 3%. These are levels less than half the peak percentages of 26% and 14% achieved for gold at $850/oz and silver at $50/oz in 1980. If we accept the global economic growth projected by the International Monetary Fund and gold production increases over the next five years along the lines projected by CMP or GFMS, then at a 10% "anxiety" percentage of GDP I can see the gold price trading in a range of $1,400–1,700/oz during the next five years. In the case of silver at 3% of GDP I see a range of $45–60 which is even better than the current $34 price.
I am confident that these new levels are the new reality, which means that this 50–70% real gain that we see in the price of gold represents a lot of potential profit to be harvested by putting into production deposits that three years ago would not have been economic. This is good news for producers and ounce-in-the-ground projects that have a significant profit margin to be captured if they are put into production and can sell their gold at prices of $1,500–2,000/oz over the next five years.
TGR: So if we assume $1,500–2,000/oz gold prices, what are some of the juniors that could profit in the next year or so?
JK: One that has been an ongoing recommendation is Spanish Mountain Gold Ltd. (SPA:TSX.V), which was formerly Skygold Ventures. It trades at about $0.80 right now. At a gold price of about $1,750/oz, it has a potential value of just under $2/share when I run the parameters published in the junior's 2010 preliminary economic assessment through a discounted cash-flow model at a 10% discount rate. At a gold price of $1,100/oz, Spanish Mountain is worthless. So this is an example of a large-tonnage, low-grade deposit, which at the prices from a few years ago is basically dead in the water.
But at the $1,750 level, it's potentially a $1.50–2 stock. If gold ends up at $2,500/oz, I could see Spanish Mountain being worth $4, but only if such a gold price rise is not accompanied by capital and operating cost escalation. I certainly do not rule out a spike toward $3,000/oz over the next few years—$3,300/oz right now would be the equivalent to $850/oz in 1980 if we take gold's value as 26% of GDP as the bubble limit. Although unsustainable, such a move would create a tidal wave of interest in the sector. It would trigger a gold price valuation paradigm switch for gold equities similar to what I am predicting for silver. People would start taking the current prices seriously and plug them into their cash-flow models instead of using $1,100/oz 3-year trailing averages for gold projects.
Instead of suspiciously viewing today's gold prices as a trend that will end terribly, people need to look back at a long-term gold chart from the early 1970s when the price went from $35/oz to $850/oz. Yes, that was a hyperbolic chart and it still stalled out. But gold stalled out at $400/oz and stabilized there. And that was a huge, 500% real increase. So we had 30 years of gold production where all this fruit that had previously been very high in the trees was suddenly turned into low-hanging fruit that the mining industry systematically harvested and added 2 Boz to the 3.2 Boz that existed in 1980. What we are witnessing now is on a somewhat smaller scale, but if you use this measure of the gold value as a percentage of global GDP, then the current percentage of about 12% is still halfway from a bubble limit where it starts becoming too much of a self-fulfilling phenomenon that has to burn out and crash back.
TGR: So what about a hybrid company? You have written about Geologix Explorations Inc. (GIX:TSX). It is trading at $0.28 now. Is that factoring in higher metals prices? Where could that go?
JK: Geologix is copper and gold. An important message I am trying to send to my audience is that gold is not inversely related to economic strength anymore. It is not a hedge against the world economy collapsing, which normally means what is good for copper is bad for gold, a reason miners who understand the meaning of "hedge" like copper-gold mines. The real price strength of both copper and gold is now twinned.
Because Geologix is still perceived as more of a potential copper producer than a gold producer, when copper prices retreated earlier this year, the stock followed. While we can argue into the wee hours whether or not my analysis of the factors driving the gold price is correct, few will dispute that strength in copper is a function of expectations that the global economy will continue to undergo growth rather than go back into a major recession.
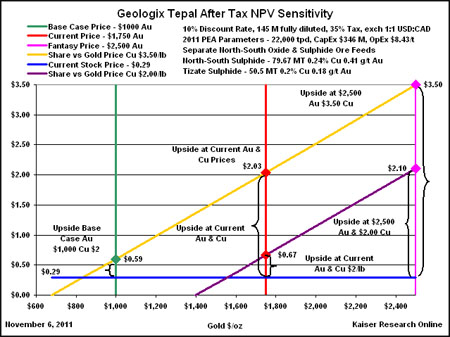
If you are inclined to believe that the global economy is more resilient than most people think, but still lean toward the notion that what is good for people in general is bad for the gold price, then a copper-gold project such as Geologix's Tepal project in Mexico merits attention. I have run discounted cash-flow models of Tepal based on the preliminary economic assessment parameters presented by Geologix in April 2011 in which I assume a pessimistic scenario of $2/pound (lb) copper and the optimistic scenario of the current $3.50 price. At the current $1,750/oz gold price, the model shows a price target of only $0.67 using a 10% discount rate, but at $3.50/lb copper the target jumps to $2.03. At $1,400/oz gold and $2/lb copper, Tepal is dead, an outcome the market already seems to be pricing into the stock at $0.29. But if copper stays at $3.50/lb and gold soars to $2,500/oz, the Geologix price target blossoms to $3.50. Geologix is thus a good example of a leveraged play on my theory that gold's strength is linked to a growing economy rather than a faltering one.
TGR: Any other good examples of how the rerating of gold prices into stock prices could impact companies you are following?
JK: One of my newer picks is a company called Probe Mines Ltd. (PRB:TSX.V). A year and a half ago, it was pretty much just limping along on the basis of a small claim it had in the McFauld's Lake area of Ontario where it covered a fraction of a chromium deposit. But since then it has made a brand-new gold discovery in the Borden Lake area of Ontario, and it just published an Inferred resource of over 4 Moz at a fairly low grade of about 0.7 grams/ton. At current prices, this represents about $40/ton. It is one of these large, disseminated gold systems that will be amenable to open-pit mining, a similar concept to Spanish Mountain. Probe has not yet done the economic scoping studies needed to identify operating and capital costs, the key to evaluating the impact of the current gold price on undeveloped gold deposits. Here is an opportunity to benefit from comparing similar deposits such as, say, Brett Resources Inc. (BBR:TSX.V) and its Hammond Reef deposit that Osisko Mining Corp. (OSK:TSX) bought for about $500M while gold had a lower price than today. Probe's total valuation is only about $187M based on 80M shares fully diluted. With expansion drilling underway there is potential to get a stock price boost from the discovery of additional ounces, not just growing confidence in the current gold price and optimism about mining costs at Borden Lake.
TGR: How high do you think it can go?
JK: In the short term, I would expect $3–4 if it delivers its preliminary economic assessment by the end of Q112 and the numbers are similar to Brett's Hammond Reef, if not better, but if the exploration drilling establishes similar mineralization along the fold of this belt where no real work has ever been done in the past, it could end up boosting this resource to a 5–10 Moz system. At that level, it starts becoming interesting to a major. Then we could see this stock flirt with a $5–10 range. Plus, it was financed earlier this year to the tune of $25M, and again a week ago for $15M, so there is no need to worry about financing dilution risk in the near term. And the Black Creek chromium asset could be a target for Cliffs Natural Resources Inc. (CLF:NYSE), which is developing its Big Daddy chromite project in Ontario. That could give this company another injection of capital without having to undergo equity dilution.
TGR: You mentioned that you now see gold as positive toward economic development, not inverse to economic health. Do you think that higher gold prices are driven by goldbugs or by investors who are looking to profit?
JK: It is my view that goldbugs are a minority. I believe the buying is by investors who are simply hedging some of the wealth, higher net worth people who are putting a portion, maybe 5%, of their wealth into gold. They have the most to lose if the world becomes unstable, and currencies fall apart relative to each other. They don't need that 5% of their wealth that they are stashing in gold. A similar thing is happening with silver, except it is driven by people in emerging nations where they cannot really afford a 1 oz gold coin and they don't trust their governments, so they are using silver to store accumulated wealth. Therefore, a lot of silver, which primarily was fabricated into industrial applications, is now being pulled out of those applications by the high price and being redistributed as a very dispersed asset class. It is not going to come back into the system quickly, just as I don't think the gold overhang is going to come back because investors decide to grab a profit and run. Frankly, I think gold and silver ownership will be quite boring in profit or loss terms during the next year, which is very good for gold and silver equities.
TGR: Thank you, John, for your insights.
John Kaiser, a mining analyst with over 25 years of experience, is editor of Kaiser Research Online. He specializes in high-risk speculative Canadian securities and the resource sector is the primary focus for an investment approach he developed that combines his "bottom-fishing strategy" with his "rational speculation model." Kaiser began work in January 1983 as a research assistant with Continental Carlisle Douglas, a Vancouver brokerage firm that specialized in Vancouver Stock Exchange listed securities. In 1989 he moved to Pacific International Securities Inc., where he was research director until April 1994 when he moved to the United States with his family. He launched the Kaiser Bottom-Fishing Report (now Kaiser Research Online) as an independent publication in October 1994 and developed it into an online commentary and information portal. He has written extensively about the junior resource sector, is frequently quoted by the media, and is a regular speaker at investment conferences. Since 2008 he has developed a focus on security of supply issues and how they relate to critical metals such as rare earths.
Want to read more exclusive Gold Report interviews like this? Sign up for our free e-newsletter, and you'll learn when new articles have been published. To see a list of recent interviews with industry analysts and commentators, visit our Exclusive Interviews page.
DISCLOSURE:
1) JT Long of The Gold Report conducted this interview. She personally and/or her family owns shares of the following companies mentioned in this interview: None.
2) The following companies mentioned in the interview are sponsors of The Gold Report: Geologix Explorations Inc., Fortuna Silver Mines Inc.
3) John Kaiser: I personally and/or my family own shares of the following companies mentioned in this interview: Geologix Explorations Inc, Spanish Mountain Gold Ltd. I personally and/or my family am paid by the following companies mentioned in this interview: None.
Streetwise - The Gold Report is Copyright © 2011 by Streetwise Reports LLC. All rights are reserved. Streetwise Reports LLC hereby grants an unrestricted license to use or disseminate this copyrighted material (i) only in whole (and always including this disclaimer), but (ii) never in part.
The Gold Report does not render general or specific investment advice and does not endorse or recommend the business, products, services or securities of any industry or company mentioned in this report.
From time to time, Streetwise Reports LLC and its directors, officers, employees or members of their families, as well as persons interviewed for articles on the site, may have a long or short position in securities mentioned and may make purchases and/or sales of those securities in the open market or otherwise.
Streetwise Reports LLC does not guarantee the accuracy or thoroughness of the information reported.
Streetwise Reports LLC receives a fee from companies that are listed on the home page in the In This Issue section. Their sponsor pages may be considered advertising for the purposes of 18 U.S.C. 1734.
Participating companies provide the logos used in The Gold Report. These logos are trademarks and are the property of the individual companies.
101 Second St., Suite 110
Petaluma, CA 94952
Tel.: (707) 981-8999
Fax: (707) 981-8998
Email: jluther@streetwisereports.com
© 2005-2022 http://www.MarketOracle.co.uk - The Market Oracle is a FREE Daily Financial Markets Analysis & Forecasting online publication.