


Stock Market Bull or Bear, This Correction Should Tell
Stock-Markets / Stock Markets 2011 Nov 20, 2011 - 06:35 AM GMTBy: Tony_Caldaro

 For the third week in a row the market had a turnaround tuesday event. Three weeks ago it hit the SPX 1215 low. Two weeks ago the SPX 1278 high. And, this tuesday the high for the week at SPX 1264. Economic reports for the week were again biased to the upside. On the downtick: the CPI/PPI, retail sales, business inventories, housing starts and the Philly FED. On the uptick: the NY FED, industrial production, capacity utilization, the NAHB housing index, building permits, leading indicators, the monetary base, the M1-multiplier, the WLEI, and weekly jobless claims improved. For the week the SPX/DOW were -3.35%, and the NDX/NAZ were -4.15%. Asian markets lost 3.0%, European markets lost 2.9%, and the DJ World index lost 3.9%. Next week’s holiday shortened economic highlights are Q3 GDP, PCE prices and the FOMC minutes.
LONG TERM: neutral
Several weeks ago we switched from long term bearish to neutral after we had observed several technical events that were more typical of a bull market rally then a bear market counter-trend rally. While in this mindset, we have had several weeks to watch and observe which of the two scenarios was likely to play out. The characteristics of both are quite simple. During a bear market the uptrends are corrective ABC’s and the downtrends impulsive 1-2-3-4-5′s. While during a bull market these roles are reversed: impulsing uptrends and corrective downtrends.
After the May11 SPX 1371 high we had two corrective uptrends and three impulsing downtrends, with the third forming a diagonal triangle into the Oct 11 SPX 1075 low. This pattern would normally be counted as an impulsing five wave structure to complete a large wave A. Then it would be followed by a rising corrective B wave (one trend), and finally a large five wave (five trends) C wave. This is exactly what occurred between Oct 2007 and Mar 2009. And, it is the reason we were able to identify that low as it was occurring.
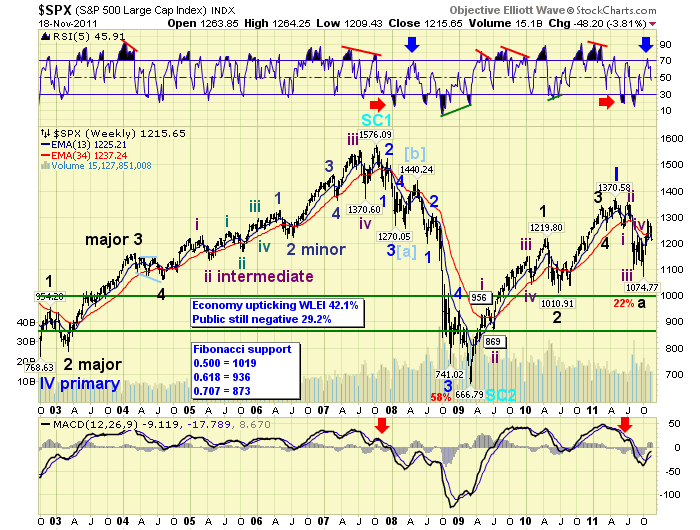
Oddly enough the May11 to Oct11 five wave decline offered an alternative count, an elongated flat. The same pattern that ended the 1987 stock market crash. An elongated flat starts as a five wave structure, declining three waves into a low. Then the market rallies in what would be considered a 4th wave, but the 5th wave decline makes a double bottom, instead of a significantly lower low, to complete the five wave decline. In 1987, for example, the 5th wave failed to even reach the low of the 3rd wave. This was counted as an elongated failed flat.
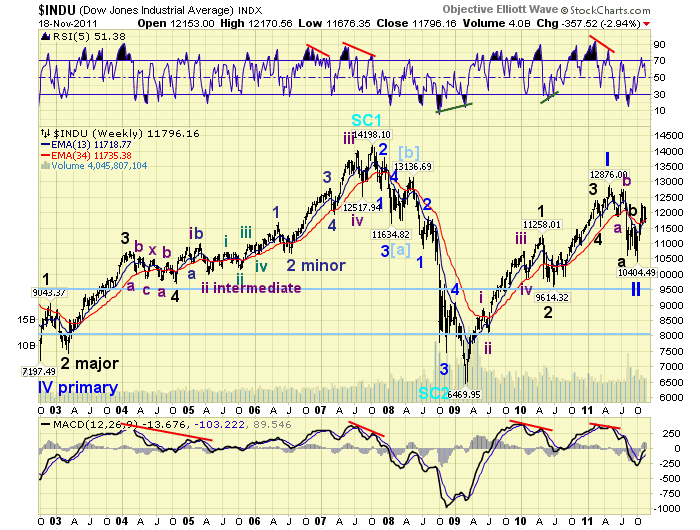
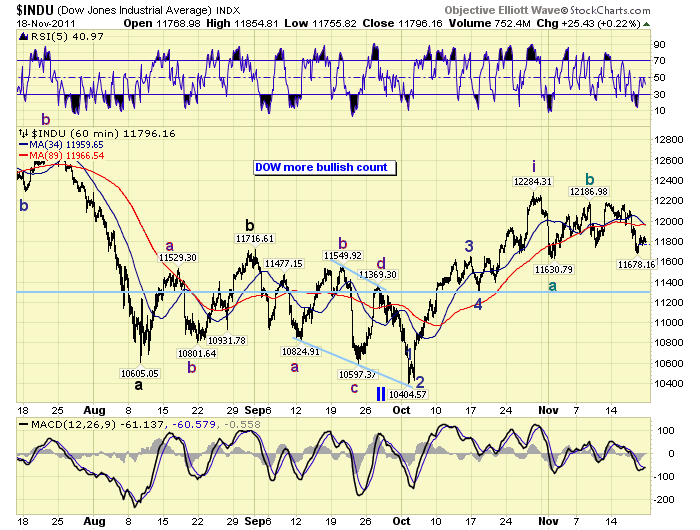
After the Oct11 SPX 1075 low the market rallied to SPX 1293, 20.3%, in only 18 trading days. We started counting it as a corrective uptrend. But as it unfolded it continued to look more and more impulsive. As a result of these two possibilites we started carrying the bearish five wave down count on the SPX charts, and the bullish elongated flat count on the DOW charts. What we have been looking for is simply this. While the uptrend was unfolding we wanted to see if it ended as impulsive or corrective. If it had ended as a corrective ABC pattern we would simply label it as a counter-trend B wave bear market rally, and then expect another five wave (five trend) decline to follow.
But so far the uptrend still looks impulsive, and we believe it ended at SPX 1293 in late October. If a downtrend is confirmed by OEW in the next few days/weeks and it is corrective, then our preferred scenario is the elongated flat and a resumption of the bull market. While OEW confirmed bear markets in many indices around the world it never confirmed a bear market in the US. This is the reason we had been posting; Long Term: “bear market highly probable”. While we are tracking the markets we can make assumptions based on various internal wave patterns. But these assumptions must eventually be quantified and confirmed by OEW. This is the main factor that separates objective EW from subjective EW.
MEDIUM TERM: uptrend appears to have ended at SPX 1293
As noted above, the uptrend from SPX 1075 to 1293 looks impulsive. If it has indeed ended at that high and OEW confirms a downtrend, then we need to observe the wave structure of the ongoing downtrend. Should it be corrective, which is already a possibility, then we would expect only a partial retracement of the recent uptrend when the downtrend concludes. At that point the count posted on the DOW charts, bull market resumes, would be the preferred count.
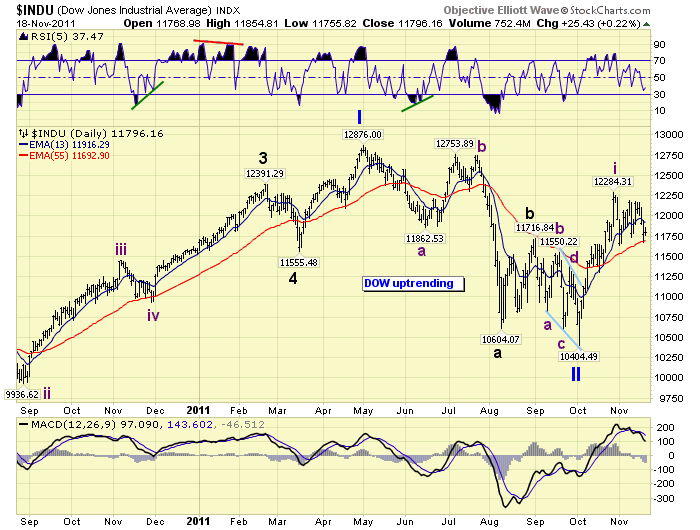
Should this potential downtrend be impulsive, then we would have to default to a resumption of the bear market scenario. And, the downtrend would likely take out the October low at SPX 1075 before it concluded. This is a very interesting juncture in the stock market.
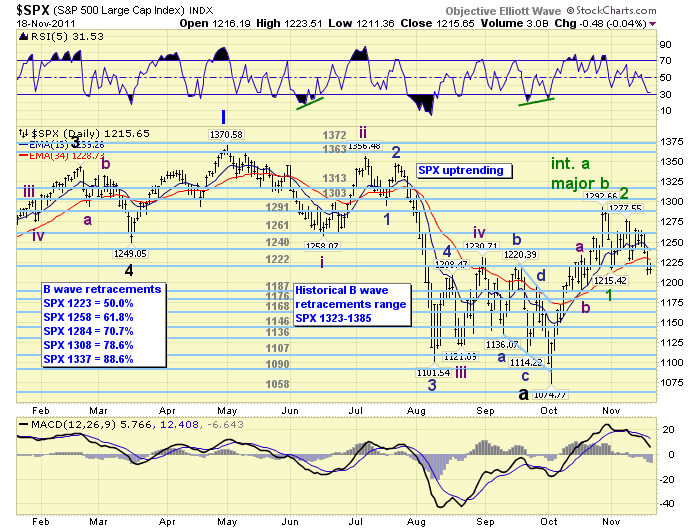
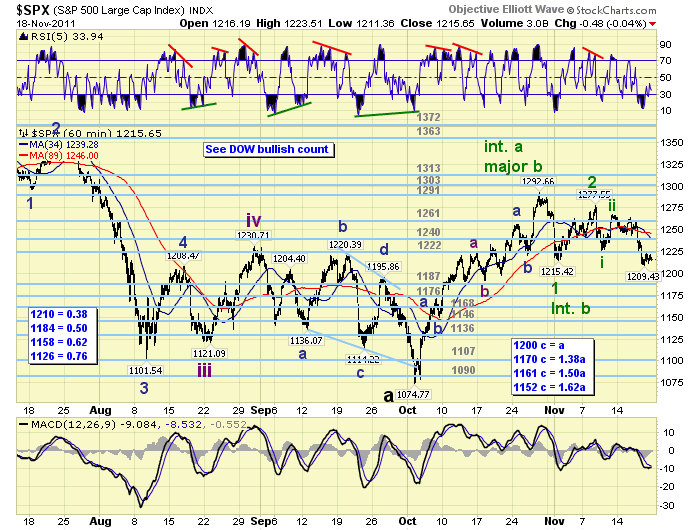
Assuming the uptrend remains impulsive and the potential downtrend corrective we posted several potential retracement levels during the week. SPX 1210 = 38.2%, (it was hit on thursday), SPX 1184 = 50%, SPX 1158 = 61.8% and SPX 1126 = 76.4%. After that we’re probably heading a lot lower. Counting from the SPX 1293 high, the first decline was to 1215 and we labeled that wave A on the DOW charts. The rally that followed to SPX 1278 we labeled wave B, wave C should be underway now. This suggests the following wave relationships for C: SPX 1200 c = a, SPX 1170 c = 1.382a, SPX 1161 c = 1.50a and SPX 1152 c = 1.618a. Within these retracements and wave relationships are the cluster of OEW pivots: 1187, 1176 and 1168. Plus, a correction of 9% from the SPX 1293 high at 1177 would not be all that unusual if the bull market is resuming. Anything over 10% and we may be looking at a bearish outcome.
SHORT TERM
Short term support is in the upper 1190′s, then the 1187, 1176, 1167 pivot cluster. While short term resistance is at the 1222 and the 1240 pivot ranges. Short term momentum ended the weak rising from an extremely oversold condition. The short term OEW charts remain with a negative bias until this market can rally into the 1240 pivot range.
We have been counting the decline from SPX 1293 as wave A, and the rally to SPX 1278 as wave B. Wave C should be underway. Within wave C we have identified a wave 1 at SPX 1227 and a wave 2 at SPX 1267. Wave 3 should now be underway. This wave 3 appears to subdividing into a smaller wave 1 at SPX 1244, a wave 2 at SPX 1265, a wave 3 possibily ending at SPX 1209, and a wave 4 underway. This suggests the upside limit to a small wave 4 rally would be SPX 1244. Therefore if our corrective count is the ongoing market count, we should see a continuation of the current choppy activity as the market works its way lower.
Some time relationships also come into play. We have observed the last two uptrends have been exactly 18 trading days, if indeed SPX 1293 ended the uptrend. And, the last two downtrends have been exactly 23 trading days. This suggests a potential downtrend low on November 28th. If we assume a 9% correction we’re looking at a potential low on November 28th around SPX 1177.
To sum it up. We’re obviously leaning toward a more bullish outcome but are remaining long term neutral until we are certain this potential downtrend is corrective. Should the market drop more than 10% from the SPX 1293 high, or below SPX 1164, we believe there could be trouble ahead for the market and the bullish scenario. As long as the market remains above this 10% cutoff, and completes a corrective pattern, we see the possibility of the US bull market extending in the months ahead. We will keep you posted. Best to your investing/trading!
FOREIGN MARKETS
The Asian markets were all lower on the week for a net loss of 3.0%. Japan’s NIKK has already confirmed a new downtrend.
The European markets were also all lower for a net loss of 2.9%.
The Commodity equity group were all lower for a net loss of 3.0%.
The DJ World index lost 3.9%.
COMMODITIES
Bonds gained 0.4% on the week and continue to look like they are uptrending, although unconfirmed.
Crude hit $103 this week in its uptrend, but sold off the last two days for a net loss of 1.3% on the week.
Gold continued to pullback in its uptrend, after hitting $1804 last week, and lost 3.6% on the week.
The USD benefitted this week from the pullback in equities and commodities, gaining 1.5% on the week. Hard to determine if it is still in an uptrend or not. The swings lately have been quite severe.
NEXT WEEK
Monday kicks off this holiday shortened week with Existing home sales at 10:00. On tuesday we have Q3 GDP at 8:30 and then the FOMC minutes at 2:00. On wednesday weekly Jobless claims, Personal income/spending, PCE prices, Durable goods orders and Consumer sentiment. Thursday is the Thanksgiving holiday and on friday the markets will reopen for an abbreviated session. Best to your weekend, week and holiday!
CHARTS: http://stockcharts.com/...
http://caldaroew.spaces.live.com
After about 40 years of investing in the markets one learns that the markets are constantly changing, not only in price, but in what drives the markets. In the 1960s, the Nifty Fifty were the leaders of the stock market. In the 1970s, stock selection using Technical Analysis was important, as the market stayed with a trading range for the entire decade. In the 1980s, the market finally broke out of it doldrums, as the DOW broke through 1100 in 1982, and launched the greatest bull market on record.
Sharing is an important aspect of a life. Over 100 people have joined our group, from all walks of life, covering twenty three countries across the globe. It's been the most fun I have ever had in the market. Sharing uncommon knowledge, with investors. In hope of aiding them in finding their financial independence.
Copyright © 2011 Tony Caldaro - All Rights Reserved Disclaimer: The above is a matter of opinion provided for general information purposes only and is not intended as investment advice. Information and analysis above are derived from sources and utilising methods believed to be reliable, but we cannot accept responsibility for any losses you may incur as a result of this analysis. Individuals should consult with their personal financial advisors.
© 2005-2022 http://www.MarketOracle.co.uk - The Market Oracle is a FREE Daily Financial Markets Analysis & Forecasting online publication.