


December Dual Trading in Progress: Views From Inter Market
Stock-Markets / Financial Markets 2011 Dec 18, 2011 - 12:40 PM GMTBy: Capital3X

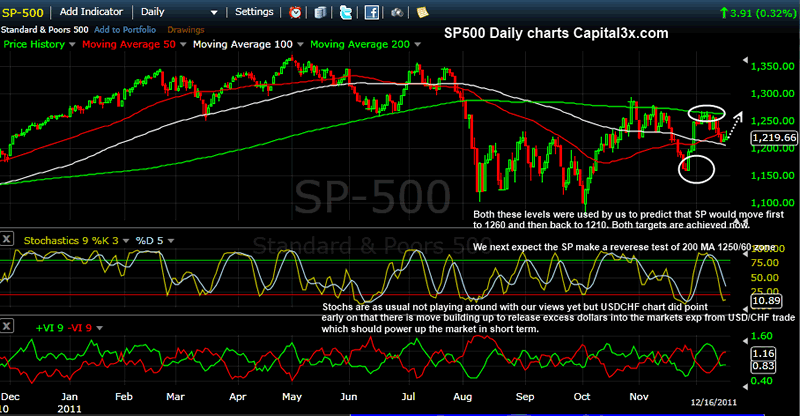
 December is tracing our views till now. First a rally to 1260 on SP500 and then a muted correction to the confluence zone at 1210 and culminating a rally back to 1250/60 zone area to finish a rather eventful and volatile year which once again brought to the fore the broken structure of the world economy.
We present key major currency charts and macro economic analysis to validate our views.
USD/CAD Daily Charts
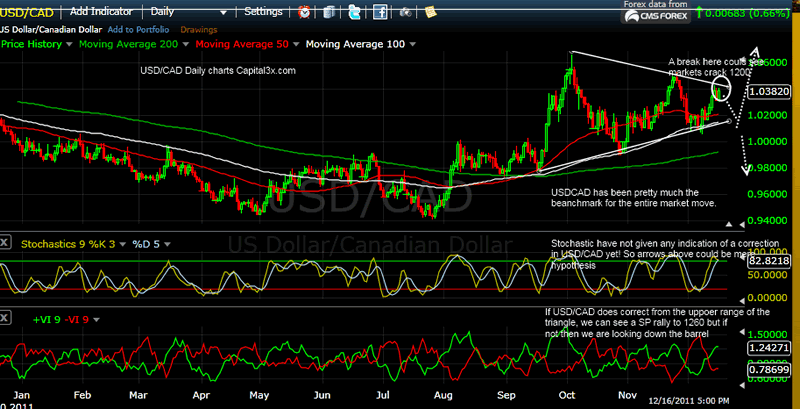
USD/CAD continues to consolidate in the upward triangle with both slants of the triangle being well respected. We expect USD/CAD to now test the lower boundary. Right now neither the stochs nor the vortex gives credence to our views and therefore it is a mere hypothesis but as we will see through USD/CHF charts, there could more to this view.
AUD/USD Daily Charts
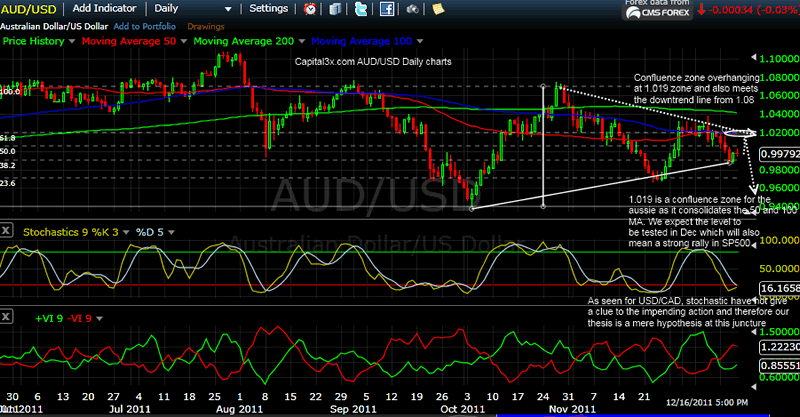
AUD/USD validates USD/CAD almost pip to pip and therefore does not add any news info. As in the case of USD/CAD, AUD/USD consolidates inside the triangle. But the looming confluence zone at 1.0180/02 zone is of special interest at 50 and 100 MA work along side the down trend line from 1.08 levels. We expect the level to be tested which will give strong support to a risk rally in the next 2 weeks.
USD/CHF Daily Charts
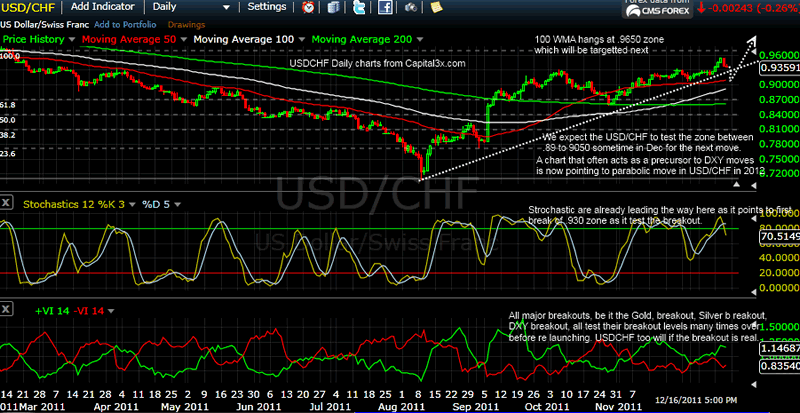
USD/CHF is the only chart from all the major pairs which have moved in advance to indicate that Risk rally could begin soon. USD/CHF has broken trend lines and is targeting .930 levels which should release enough liquidity into the system to sustain a rally on all risk assets. USD/CHF is among the finest benchmarks of the DXY index and therefore is used quite heavily in the intermarket analysis. Unlike AUD/USD and USD/CAD, USDCHF stochs have already moved to indicate a short term down move to test key levels.
SP500 Daily Charts
10 Year yields moves in range
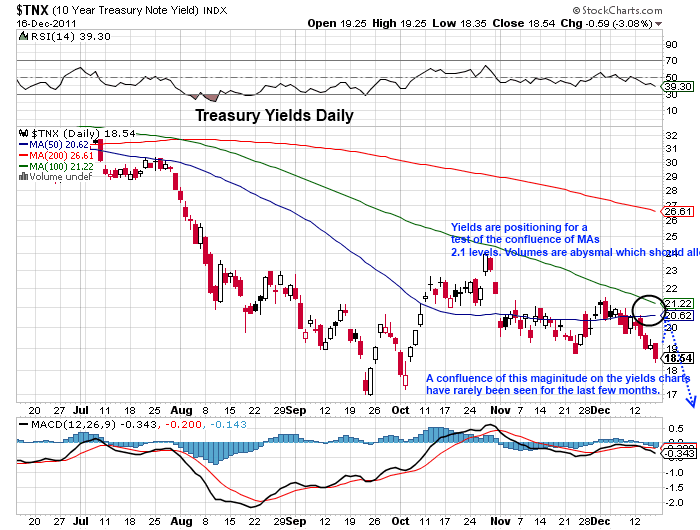
US treasury yields are off their all time lows and are now consolidating below multiple MAs capping its rise. The confluence zone at 2.1 level should attract interest towards the year end.
EU PMISs: A false sense of security?
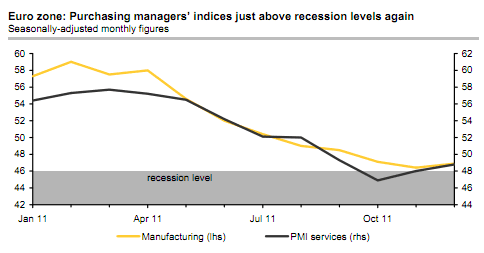
The purchasing managers’ indices (PMIs) for the euro zone surprised to the upside in December. In contrast to what was widely expected, they did not fall any further but rose slightly. This certainly reduces the risk of a steep drop in activity in the euro zone. However, we think it would be premature to say that this marks a turn for the better as the sovereign debt crisis will continue constraining economic activity in the euro zone for a long while yet.
US production muted
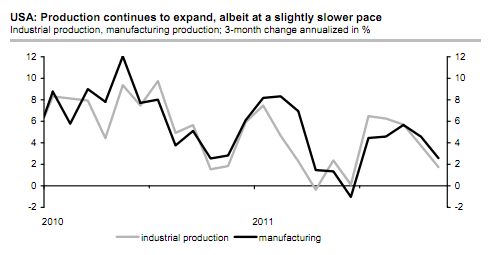
US industrial production declined 0.2% in November. While the headline number disappoints, the details of the report are less negative. All in all, the report is consistent with an ongoing moderate expansion of US industry. At first sight, industrial production’s 0.2% decline in November disappointed relative to
expectations. The October basis, however, was revised upward by three tenths. A relatively modest number for November had already been foreshadowed by the employment report which showed that production workers in the manufacturing sector worked fewer hours. Indeed, in the ‘core’ manufacturing sector, production declined even 0.3%, but this was largely the consequence of supply constraints in the car industry in the wake of flooding in Thailand as motor vehicle and parts output slumped 3.4%. It is to be seen if the effect can be reversed over the coming months.
On the debt side, Italy continues to make progress on the debt and deficit management. But markets will need greater credible proof as Italy has been found the fudge numbers.
According to the latest figures, Italy made progress on budget consolidation in October. The country is now ahead of target: The deficit goal for 2011 of 3.9% of GDP is therefore within reach. The VAT increase has led to a significant rise in revenues. The Monti government’s new reform package increases the chances of a balanced budget by 2013. The new figures from the Banca d’Italia show that the budget deficit was significantly reduced in September. In the first ten months of 2011 the deficit was € 9.3bn less than in the same period of 2010. This corresponds to 0.6% of GDP (black bar in chart). The government’s aim is to reduce total new public borrowing this year to just 0.5% of GDP. The income and expenditure situation of the Italian government is even expected to improve further in the last two months of the year: In mid-September VAT was increased by one percentage point, which should lead to higher revenues in November and December. Italy’s new prime minister Mario Monti is planning further cuts. A key component of the austerity package is the reintroduction of property tax (approx. € 3.5bn p.a.). There will also be increases in excise duties on luxury goods, for example. On the expenditure side, the planned pension reform stands out. The package increases the likelihood that, despite a weak economy (the government now shares our view that the economy will shrink slightly in 2012 and see little growth in 2013), Italy will have a balanced budget from 2013 onwards. The package should be adopted by the Chamber of Deputies today, combined with a vote of confidence (final vote 6pm, vote of confidence around midday). The Senate will vote on Sunday.
There is a lingering rumor that France is to be downgraded and will become the second major economy to be downgraded after US. We knew a downgrade on US was coming and so did the markets, and yet when it did come, markets were walloped. If France is actually downgraded (We see less of a chance of that), expect the contrarian case of all the charts above which means we could see a further fall in risk assets and USD/CAD to break out of its ascending triangle.
You can log in to the C3X live trading room to be notified of the latest market events as they occur. It is also a room where we discuss our premium trades.
We continue to watch the price action and will update our premium subscribers with new analysis and charts. Our trade portfolio (Forex, SPX Emini, Crude, Gold, Silver) is visible to our premium subscribers
Our feeds: RSS feed
Our Twitter: Follow Us
Kate
Capital3x.com
Kate, trading experience with PIMCO, now manage capital3x.com. Check performance before you subscribe.
© 2011 Copyright Capital3X - All Rights Reserved
Disclaimer: The above is a matter of opinion provided for general information purposes only and is not intended as investment advice. Information and analysis above are derived from sources and utilising methods believed to be reliable, but we cannot accept responsibility for any losses you may incur as a result of this analysis. Individuals should consult with their personal financial advisors.
© 2005-2022 http://www.MarketOracle.co.uk - The Market Oracle is a FREE Daily Financial Markets Analysis & Forecasting online publication.