


Stocks Bull Market Continues
Stock-Markets / Stock Markets 2012 Jan 23, 2012 - 03:11 AM GMTBy: Tony_Caldaro

 The US rally extends to three up weeks in a row. While volatility has virtually disappeared this new year the market continues to work its way higher. For the week the SPX/DOW were +2.20%, and the NDX/NAZ were +2.75%. Foreign markets also joined in, with Asia and Europe both +3.10%, as was the DJ World index. Economic reports for the week were biased to the upside: 8 to 5. On the downtick: the PPI, housing starts, building permits, the Philly FED and the M1-multiplier. On the uptick: the NY FED, industrial production, capacity utilization, existing homes sales, the NAHB, the monetary base, the WLEI and weekly jobless claims improved. Next week, the FED meets tuesday and wednesday, then Leading indicators and Q4 GDP. Best to your week!
LONG TERM: bull market
After a volatile spring and summer, that threatened to push the world’s economy into another economic meltdown, the markets and economy have recovered in the fall and winter. Pledges from the Eurozone to stabilize the sovereign debt crisis in early October helped put in the market low. Then the ECB’s recapitalization of european banks with LTRO 2, in early December, helped to keep the liquidity engine running. This was especially important, in this deflationary period, as the FED had shut down their QE 2 program in June. Then, after a “wait and see” market inflection point in December. January has signalled an all clear to the upside. Our technical indicators and the market’s activity suggest the bull market of March 2009 is back.
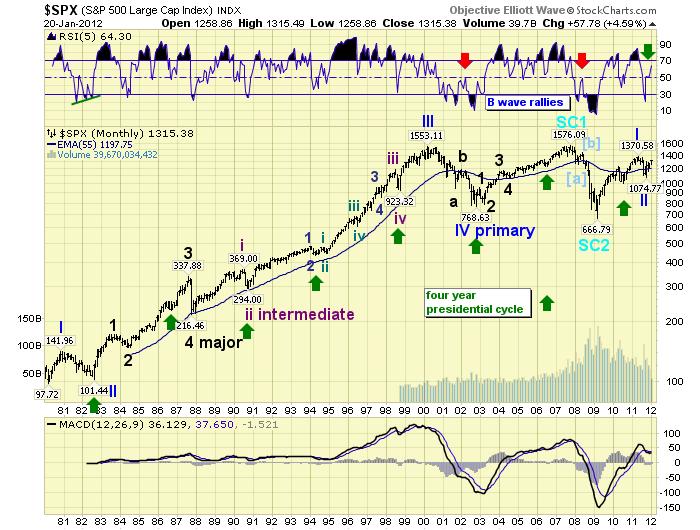
While the B wave, of Primary wave II, scenario is still possible. A glance at the monthly RSI suggests this is becoming less and less probable. Notice the previous two bear market B wave rallies stopped at the neutral line: red arrows. This advance, from the SPX 1075 low, did stall at that level for a while. But has broken clearly through it during this month’s advance: green arrow. With only 7 trading days to go in the month, this is a bullish sign.
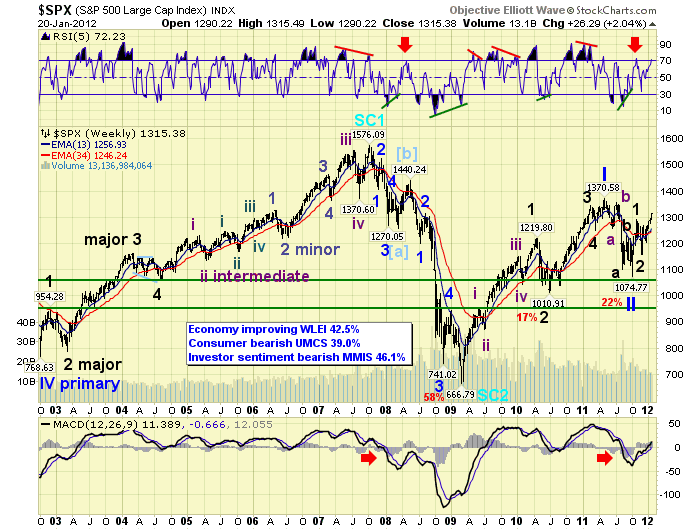
The weekly indicators have also turned positive. After hitting an extremely oversold, typical bear market, condition in mid 2011 the Major wave 1 uptrend hit overbought and now this uptrend threatens to break through that level to possibly an extremely, typical bull market, overbought. The MACD, which broke below neutral into bear market territory, is now rising above neutral into bull market territory. As long as these trends continue the bull market remains in force. In the mean time, the economy is still soft with consumers and investors still bearish. This is a perfect set up for the resumption of a bull market.
After the 58% stock market loss during Oct07 – Mar09, to end Supercycle wave 2. We expected Cycle wave [1], of Supercycle 3, to carry the market up in five Primary waves. Primary waves I and II ended in May11 and Oct11 respectively. Primary wave III should be underway now. Rising primary waves divide into five Major waves. Major waves 1 amd 2, of Primary III, ended in Oct11 and Nov11 respectively. Major wave 3 should be underway now. This Major wave may subdivide into five Intermediate waves. Similar to Major wave 1 between Mar09 and Apr10. Currently we are anticipating this event.
MEDIUM TERM: uptrend high SPX 1315
The daily chart below offers a good view on Primary wave II and the current progress of Primary wave III. Notice the May11-Oct11 decline was five waves, but appears to have taken the form of an elongated flat. The same pattern that ended the 1987 crash. The SPX lost 22% during that 1371-1075 decline. But has already retraced 81% of that loss during the early stages of Primary wave III. In fact, it is less than 4.5% from making a new bull market high. New bull market highs have already been hit by four of the nine SPX sectors: XLK, XLP, XLY and XLU. With the fifth, XLV, only a few ticks away. This does not occur during bear markets, nor bear market rallies.
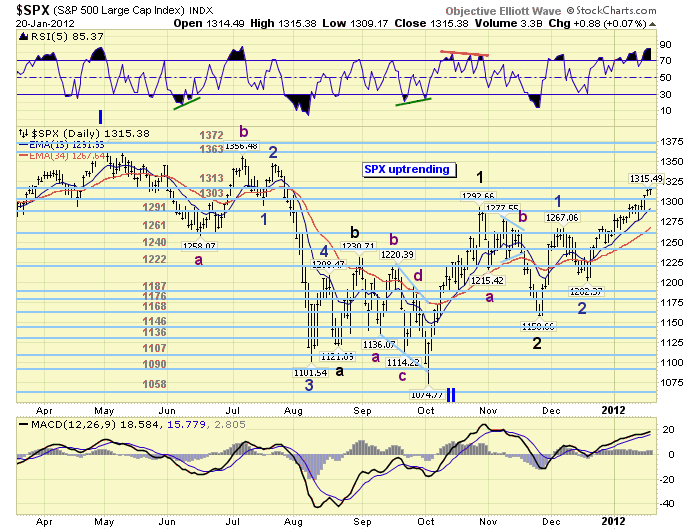
From the early October SPX 1075 low the market rocketed to SPX 1293 in less than four weeks, ending Major 1. A corrective Major 2 correction followed to SPX 1159. Since then this market has been uptrending. During the uptrend we labeled Minor 1, of a potential Intermediate wave i uptrend, at SPX 1267. Then Minor wave 2 At SPX 1202. Minor wave 3 just hit SPX 1315 this week. After it concludes we should get a Minor 4, with support at SPX 1267. Then Minor wave 5 to conclude the uptrend. Currently the market is quite overbought on the daily RSI.
SHORT TERM
Support for the SPX is at the 1313 and 1303 pivots, with overhead resistance at the 1363 and 1372 pivots. Short term momentum has risen to just overbought after hitting neutral early friday. Minor wave 1 unfolded in a complete nine waves. We marked the basic five wave structure with Minute waves on the hourly chart. Minor wave 3 has thus far unfolded in an incomplete 15 waves. We again have marked the basic five wave structure with Minute waves i-ii-iii-iv on the hourly chart.
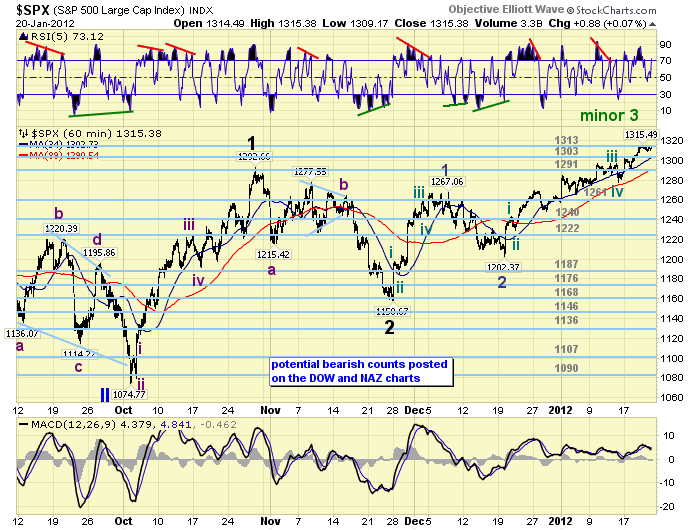
Minute wave v, the smallest of the waves, has thus far rallied in an incomplete three waves up from the Minute iv SPX 1278 low. It should have at least one more notable pullback, with support at SPX 1303, then another rally to a higher high to complete Minor wave 3. A potential scenario suggests the market opens higher on monday. Then sells off for the rest of the day. Rallies tuesday/wednesday, during the FOMC meeting, on QE 3 rumors. Then pulls back substantially, with SPX 1267 support for Minor wave 4, when no QE 3 is announced.
Currently there is absolutely no pivot resistance until the SPX enters the 1363 pivot range. Quite a gap between the 1313 and 1363 pivots. There is however some price resistance at the following levels: 1327, 1345/47 and then 1356, which is within the 1363 pivot range. Should this uptrend clear SPX 1327 we would have to consider the entire uptrend as a possible Major wave 3, rather than an Intermediate wave one of 3. Short term OEW charts have remained postive since under SPX 1230, with support now just under 1300. Short term support is at the 1313, 1303 and 1291 pivots. Overhead resistance is at SPX 1327, 1345/47 and then the 1363 pivot. Short term momentum is rising. Best to your trading!
FOREIGN MARKETS
The Asian markets were all higher on the week for a net gain of 3.1%. Only China and India have not confirmed uptrends.
The European markets were also all higher for a net gain of 3.1%. Italy is still in a downtrend.
The Commodity equity group were all higher for a net gain of 3.5%. Only Russia has not confirmed an uptrend.
The DJ World index is uptrending and gained 3.1% on the week.
COMMODITIES
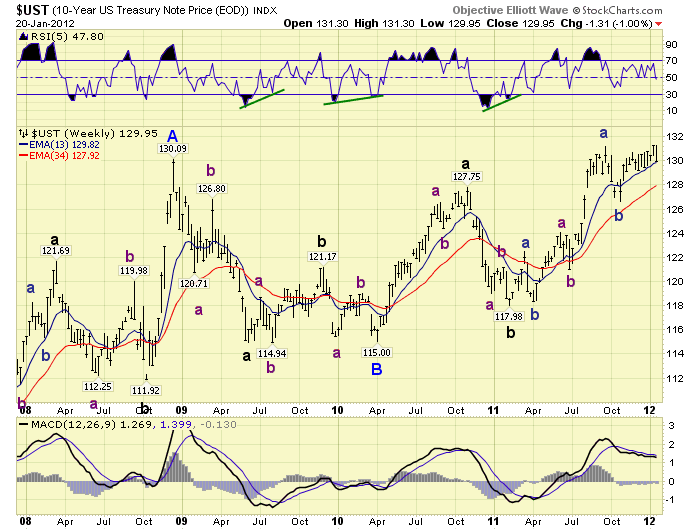
Bonds lost 1.0% on the week as the choppy, trading range, uptrend from October appears to be weakening. Should a downtrend be confirmed Bonds could have a substantial drop as this last uptrend could complete a large Major ABC pattern from the April 2010 low.
Crude remains a volatile commodity, uptrending but losing 0.5% on the week.
Gold (+1.5%) appears to be uptrending from the December $1524 low. On friday it broke out of a week long trading range to the upside. Silver gained 7.7% on the week. Most of it on friday.
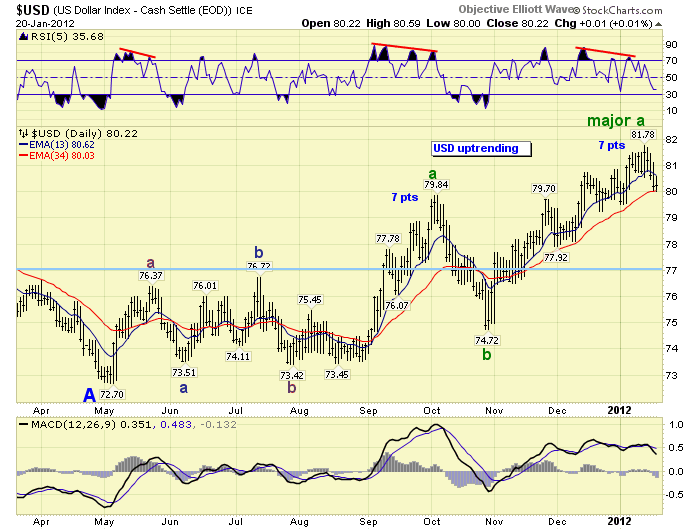
The USD (-1.6%) appears to be in a weakening uptrend. We have negative divergences at the recent highs. Similar to the Sept/Oct highs. And both rallies, during this lengthy six month uptrend are equal in length.
NEXT WEEK
Economic reports for the week kicks off on wednesday with Pending home sales, FHFA housing prices and the FED’s FOMC statement. On thursday, weekly Jobless claims, Durable goods orders, Leading indicators and New home sales. Then friday ends the week with the Q4 GDP estimate and Consumer sentiment. Best to your weekend and week!
NOTE
We have been been tracking five CEF’s (closed end funds), and two penny stocks at the back of the charts. Now that we have tracked them for a few months and are satisfied with the price activity, we will move them into the mix with the other stocks. We are not recommending these stocks. Just trying to offer some additional investment ideas for our readers. Good luck!
CHARTS: http://stockcharts.com/...
http://caldaroew.spaces.live.com
After about 40 years of investing in the markets one learns that the markets are constantly changing, not only in price, but in what drives the markets. In the 1960s, the Nifty Fifty were the leaders of the stock market. In the 1970s, stock selection using Technical Analysis was important, as the market stayed with a trading range for the entire decade. In the 1980s, the market finally broke out of it doldrums, as the DOW broke through 1100 in 1982, and launched the greatest bull market on record.
Sharing is an important aspect of a life. Over 100 people have joined our group, from all walks of life, covering twenty three countries across the globe. It's been the most fun I have ever had in the market. Sharing uncommon knowledge, with investors. In hope of aiding them in finding their financial independence.
Copyright © 2012 Tony Caldaro - All Rights Reserved Disclaimer: The above is a matter of opinion provided for general information purposes only and is not intended as investment advice. Information and analysis above are derived from sources and utilising methods believed to be reliable, but we cannot accept responsibility for any losses you may incur as a result of this analysis. Individuals should consult with their personal financial advisors.
© 2005-2022 http://www.MarketOracle.co.uk - The Market Oracle is a FREE Daily Financial Markets Analysis & Forecasting online publication.