


Crane Co: An Undervalued Dividend Challenger
Companies / Corporate Earnings Apr 11, 2012 - 12:04 AM GMTBy: Fast_Graphs

 Crane Co. (CR) is a diversified manufacturer of highly engineered products with over $2.5 billion in sales. Fluid Handling is their largest segment with $1.1 billion in sales, followed by Aerospace & Electronics with $6.78 million, followed by Merchandising Systems with $374 million, followed by Engineered Materials with $220 million, and finally Controls with $120 million. However, in spite of their diversified businesses, the historical earnings record of this high-quality Mid-cap suffers from periods of cyclicality (see earnings graph below). Therefore, even though the company has strung together seven consecutive years of dividend increases that qualify it as a Dividend Challenger, prospective investors should consider their past record of dividend freezes during cyclical times.
This article looks at Crane Co (CR), a Dividend Challenger, through the lens of the F.A.S.T. Graphs™ Fundamentals Analyzer Software Tool. Since a picture is worth a thousand words, the reader will be provided the "essential fundamentals at a glance" expressed vividly in pictures. In order to provide you the opportunity to research this company deeper and faster we are providing a link to a live, fully functioning earnings and price correlated set of graphs Found Here. (Tip: Run your mouse over the various lines and watch the graphs come to life).
A Dividend Challenger is defined as a company that has increased its dividend every year for 5-9 straight years. Crane Co is a Dividend Challenger that has raised its dividend every year for 7 consecutive years. The complete Dividend Challengers list is compiled courtesy of David Fish. (Open as an excel spreadsheet and look at the tabs on the bottom to find the Dividend Challengers list).
About Crane Co: from their website
"Crane Co. is a diversified manufacturer of highly engineered industrial products. Founded in 1855, Crane provides products and solutions to customers in the aerospace, electronics, hydrocarbon processing, petrochemical, chemical, power generation, automated merchandising, transportation and other markets. The Company has five business segments: Aerospace & Electronics, Fluid Handling, Engineered Materials, Merchandising Systems and Controls. Crane has approximately 11,000 employees in North America, South America, Europe, Asia and Australia. Crane Co. is traded on the New York Stock Exchange (NYSE:CR)."
Crane Co: A Dividend Challenger with 7 Consecutive Years of Dividend Increases Learning from the Past - Looking at Earnings Only
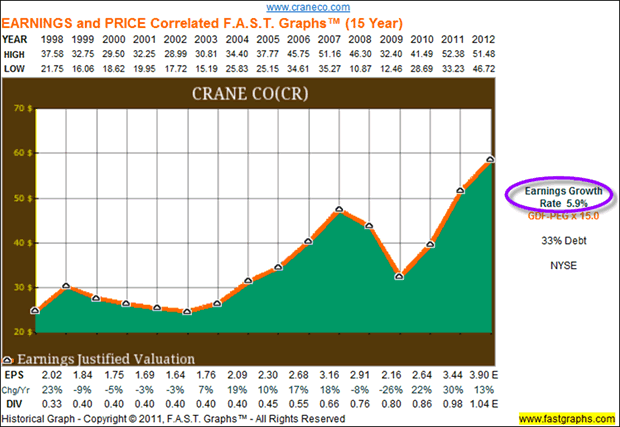
Since dividends are paid out of earnings, a clear perspective of a company's historical earnings growth record is a vital component of a dividend investor's prudent due diligence process. The following graph plots Crane Co's earnings per share since 1998 . A quick glance to the right of the graph shows that Crane Co has increased earnings at a compounded rate of 5.9% (see purple circle on graph) per annum .
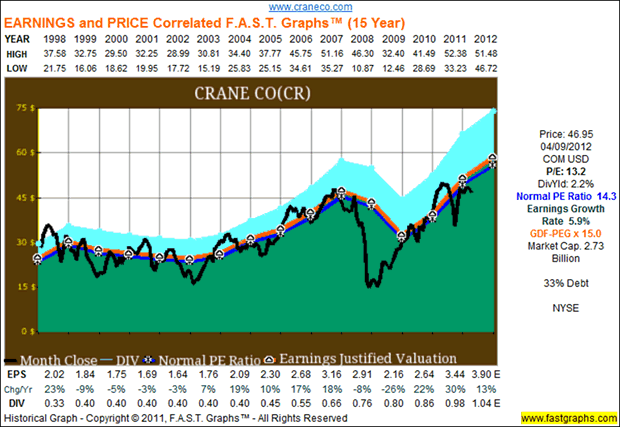
Earnings Determine Market Price and Dividend Income: The following earnings and price correlated F.A.S.T. Graphs™ clearly illustrates the importance of earnings to both price movement and dividend income. The earnings growth rate line or True Worth ™ line (orange line with white triangles) is correlated with the historical stock price line. On graph after graph the lines will move in tandem. If the stock price strays away from the earnings line (over or under), inevitably it will come back to earnings.
Since dividends are paid out of earnings, and therefore represent additional return on top of what the market capitalizes earnings at, they are depicted by the light blue shaded area and stacked on top of the earnings line. Therefore, a quick visual of these two important components is simultaneously revealed:
-
The additional return that dividend paying stocks provide.
-
The percentage of earnings paid to shareholders as dividends (payout ratio).
The value in this article is through carefully analyzing the earnings and price correlated fundamentally based graphs. Notice that one glance tells you how well the company has performed on an operating basis historically and how the market valued that historical performance. Therefore, the reader is free to discover whether or not current valuations make sense based on historical norms coupled with fundamental values. Instead of opinion, this article is designed to produce facts that can be analyzed to the readers investing benefit.
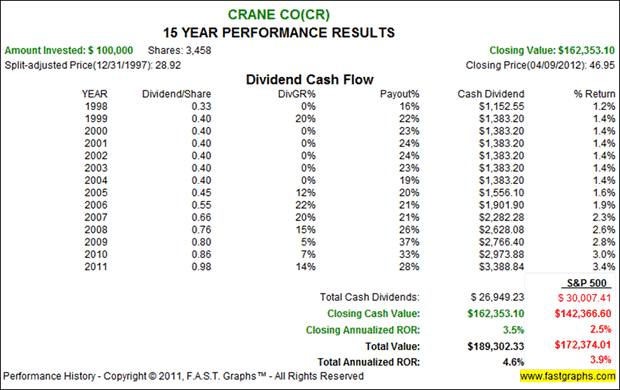
Performance Table: Capital Appreciation and Dividend Income Crane Co
The associated performance results, with the earnings and price correlated graph, validates the above discussion regarding the two components of total return: Capital appreciation and dividend income. Dividends are included in the total return calculation and are assumed paid, but not reinvested.
When presented separately like this, the additional rate of return a dividend paying stock produces for shareholders becomes undeniably evident. In addition to the 3.5% capital appreciation (Closing Annualized ROR), long-term shareholders of Crane Co would have received an additional $26,949.23 in dividends that increased their total return from 3.5% to 4.6% per annum.
(Note: Since this is a Dividend Challenger it has raised its dividend every year for at least 5-9 years, therefore, negative dividend growth rates shown, if any, will be attributed to special additional dividends paid in excess of the company's regularly reported dividend rate)
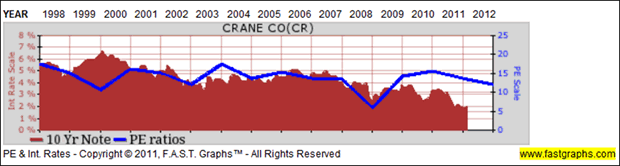
The following graph plots the historically normal PE ratio (the dark blue line) correlated with 10-year Treasury note interest. Notice that the current price earnings ratio on this quality company is as normal as it has been since 1998.
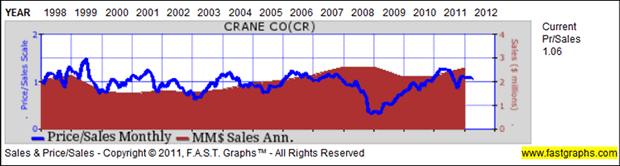
A further indication of valuation can be seen by examining a company's current price to sales ratio relative to its historical price to sales ratio. The current price to sales ratio for Crane Co is 1.06, which is historically normal.
Looking to the Future
Extensive research has provided a preponderance of conclusive evidence that future long-term returns, and the dividend and its growth rate are a function of two critical determinants:
-
The rate of change (growth rate) of the company's earnings
-
The price or valuation you pay to buy those earnings
Therefore, forecasting future earnings growth, bought at sound valuations, is the key to safe, sound, and profitable performance.
Therefore, it logically follows that measuring performance without simultaneously measuring valuation is a job half done. At its current price, which is attractively aligned with its True Worth™ valuation, Crane Co represents a potential opportunity to invest in a Dividend Challenger at a reasonable price. The important factor is that Crane Co has real assets and cash flow underpinning its stock price. This solid economic foundation offers shareholders the potential for both a strong margin of safety and an opportunity for an increasing dividend income stream and potentially attractive future returns.
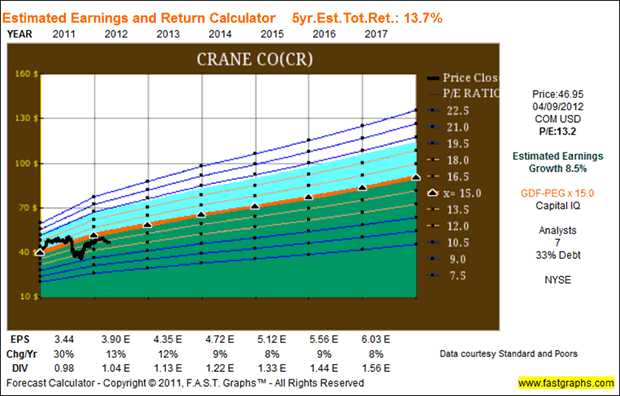
The Estimated Earnings and Return Calculator Tool is a simple yet powerful resource that empowers the user to calculate and run various investing scenarios that generate precise rate of return potentialities. Thinking the investment through to its logical conclusion is an important component towards making sound and prudent commonsense investing decisions.
The consensus of 7 leading analysts reporting to Capital IQ forecast Crane Co long-term earnings growth at 8.5%. Crane Co has medium long-term debt at 33% of capital. Crane Co is currently trading at a P/E of 13.2, which is inside the value corridor (defined by the five orange lines) of a maximum P/E of 18. If the earnings materialize as forecast, Crane Co's True Worth valuation would be $90.43 at the end of 2017, which would be a 13.7% annual rate of return from the current price, including assumed dividends.
Earnings Yield Estimates
Discounted Future Cash Flows: All companies derive their value from the future cash flows (earnings) they are capable of generating for their stakeholders over time. Therefore, because Earnings Determine Market Price and dividend income in the long run, we expect the future earnings of a company to justify the price we pay.
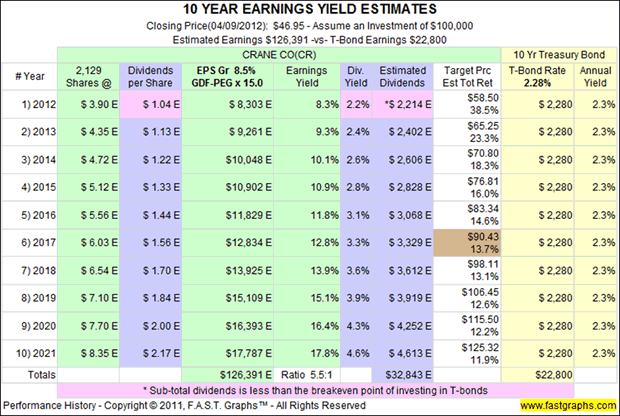
Since all investments potentially compete with all other investments, it is useful to compare investing in any prospective company to that of a comparable investment in low risk Treasury bonds. Comparing an investment in Crane Co to an equal investment in 10-year Treasury bonds illustrates that Crane Co's expected earnings would be 5.5 times that of the 10-Year T-Bond Interest. (See EYE chart below). This is the essence of the importance of proper valuation as a critical investing component.
This report presents essential "fundamentals at a glance" on Dividend Challenger Crane Co, illustrating the past and present valuation based on earnings achievements as reported. Future forecasts for earnings growth are based on the consensus of leading analysts. Although with just a quick glance you can know a lot about the company, it's imperative that the reader conduct his or her own due diligence in order to validate whether the consensus estimates seem reasonable or not. Follow the link we provided at the beginning of this article to a fully functioning F.A.S.T. Graphs™ on Crane Co.
Summary & Conclusions
Crane Co. is a high-quality mid-cap that can be purchased at a below historical normal valuation. The company offers an above market current dividend yield which is forecast to grow at above-average rates for the next 3 to 5 years. Consequently, prospective investors seeking a high-quality mid-cap company with room to grow with an above market dividend yield that can simultaneously be purchased at a sound evaluation might want to look deeper into Crane Co.
Disclosure: No position at the time of writing.
By Fast GraphsDisclaimer: The opinions in this document are for informational and educational purposes only and should not be construed as a recommendation to buy or sell the stocks mentioned or to solicit transactions or clients. Past performance of the companies discussed may not continue and the companies may not achieve the earnings growth as predicted. The information in this document is believed to be accurate, but under no circumstances should a person act upon the information contained within. We do not recommend that anyone act upon any investment information without first consulting an investment advisor as to the suitability of such investments for his specific situation.
© 2005-2022 http://www.MarketOracle.co.uk - The Market Oracle is a FREE Daily Financial Markets Analysis & Forecasting online publication.