


Stock Market Short-term Decline in Progress, Will Gold Follow or Not?
Stock-Markets / Financial Markets 2012 Apr 16, 2012 - 02:58 AM GMTBy: Andre_Gratian

 Current Position of the Market
SPX: Very Long-term trend - The very-long-term cycles are down and, if they make their lows when expected (after this bull market is over) there will be another steep and prolonged decline into late 2014. It is probable, however, that the steep correction of 2007-2009 will have curtailed the full downward pressure potential of the 120-yr cycle.
SPX: Intermediate trend - The intermediate uptrend is still intact, but a short-term top may already have started to take shape.
Analysis of the short-term trend is done on a daily basis with the help of hourly charts. It is an important adjunct to the analysis of daily and weekly charts which discusses the course of longer market trends.
Market Overview
It's looking more and more as if a correction of the stock market has started. Important trend lines were broken in early April which brought about the greatest amount of weakness since the early December top. The SPX topped out at 1422.38, a few points lower than my 1427 projection and started a 5-day decline which ended at 1357.38. This was followed by a rally which retraced 50% of the pull-back to 1388.13. Last Friday, the index rolled over once again and ended the day with a 17-point loss, essentially retracing all of the previous day's big gain.
There is every indication that the SPX is initially heading for the 1340 level on this pull-back. Logically, that could be the level where the correction ends. There is a Point & Figure count to that level and, from a structural perspective, if 1422 was the top of wave 5 from 1159, normal expectations would be for a retracement to the 4th wave of a lesser degree, which is 1340.03.
While reaching that level could provide a rebound of prices, the amount of distribution which occurred on the P&F chart at the 1410 level calls for a drop to about 1300. Even that may not be the end of the correction. Another count taken at the 1398 level gives us a target of 1245. These P&F projections point to the price levels which could be reached. What about the time factor? The first meaningful cycle bottoms at the end of the month. But it may only usher in a temporary counter-trend move because there is also a cluster of cycles due to make their lows in early June which could bring about even lower prices. Conceivably, this is the time frame in which the correction could end at the 1245 target.
It may be difficult for the investor who has been conditioned to an ever-rising stock market to conceptualize that much weakness over the next couple of months, but the price and time figures which have been obtained by P&F projections and cycle analysis are also supported by Fibonacci time and price measurements, and this gives them added credibility. Does this mean the correction could not end either earlier, or at a higher level? Of course not! But neither should these possibilities be discounted. The stock market will be the final arbiter and all we have to do is to pay attention to what it tells us.
Chart analysis
I will start by showing the Weekly Chart because it presents a simplified, overall view of the market position. There is no question that the SPX has had a reversal in trend. Last Friday, it closed at its lowest price level in 5 weeks. If the price action itself does not convince you, look at the Stochastic RSI. It started to waiver three weeks ago and finally took a plunge last week. The MACD is always slower at getting going and it has not yet confirmed the decline, but the trend in the histogram is clearly down and should soon turn negative. The daily did so a week ago.
The red horizontal line indicates the level of the former short-term bottom, and it is expected to provide some temporary support. However, if it is penetrated, the lower projections become more likely.
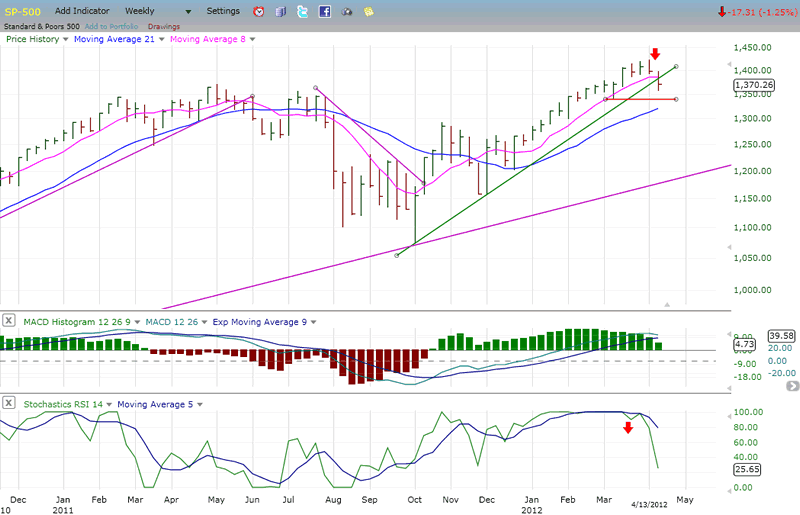
The trend line has clearly been broken, with the price closing outside of it as well as below the shorter MA for the first time in 17 weeks
These are good reasons to expect more of a decline before the SPX can make a low. Furthermore, since the market tends to move in 3 or 5 waves, and all we have, so far, is a single wave down, upon its completion we can expect a rebound followed by another down wave. If the latter takes us below the red line, we should next be headed for the 1300 area.
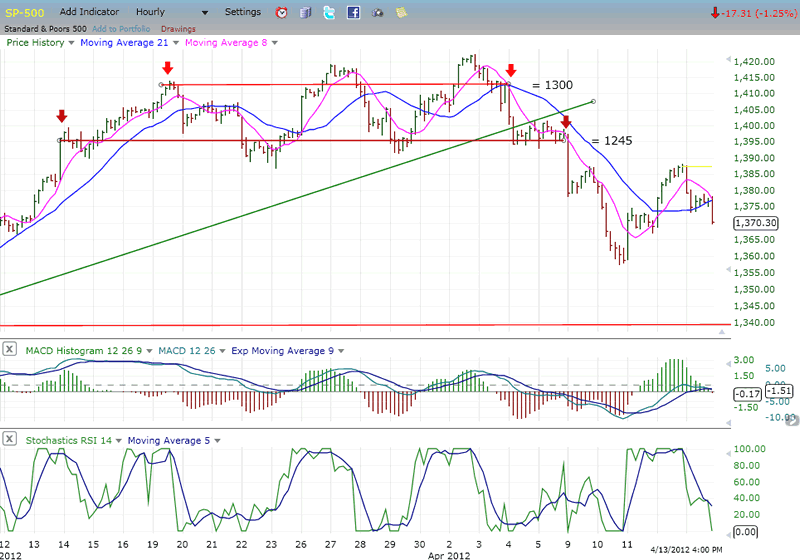
Analyzing the daily chart would be mostly repetitive, so let's jump directly to the Hourly Chart to see if a short-term low is in sight. After an initial drop to 1358 in 5 waves, the SPX had a rally in 3 waves and, on Friday resumed its downtrend, closing below its two moving averages, below the former near-term low, and on its low of the day. This is bearish behavior which suggests that the decline is not over.
The stochastic RSI is still declining and the MACD is about to cross over to the negative side. This action is consistent with pressure being exerted by a minor cycle bottoming on Tuesday or Wednesday, probably at the 1354-1355 level.
Cycles
Cycles can be tricky! Their phases are not always replicated exactly, their effect on prices varies within up and down trends, and some occasionally invert. That being said, they are still one of the most important analytic tools for timing the market..
Two minor cycles are scheduled to make their lows on Tuesday/Wednesday.
A much more influential cycle is due to bottom at the end of the month.
But the biggest draw-down should come into the first or second week of June when three important market cycles make their lows within the space of a week.
Breadth
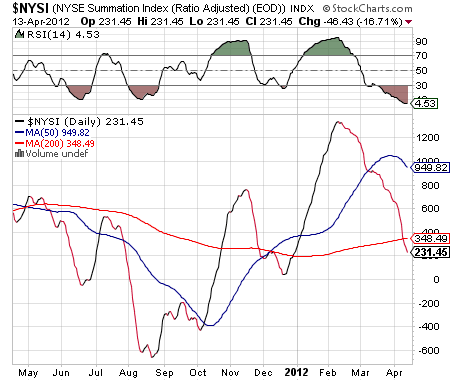
The NYSE Summation Index (courtesy of StockCharts.com) continues to make new lows, and will continue to do so until the McClellan oscillator can become positive on balance once again. Its RSI looks as if it is beginning to flatten out, a sign of deceleration in the main index.
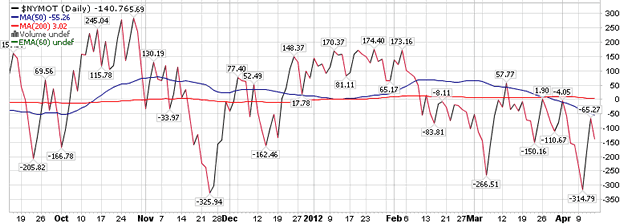
Below the Summation Index, I have posted a chart of the NYSE McClellan oscillator. Except for one brief peak above the line, the index has been negative for the past 8 weeks. This is why the NYSI continues to decline. When the NYMO becomes positive again, it will be in conjunction with a rally in the market.
Note that the two-day rally we just experienced could not turn the NYMO decisively, and that it has started down again. Since the last low was an oversold new low, the next low should be at a higher level, creating positive divergence and preparing the market for a rally.
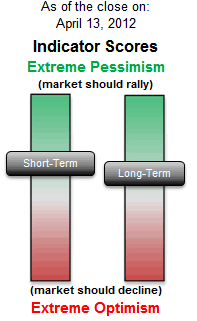
Sentiment
The SentimenTrader (below, courtesy of same) has improved with the market sell-off. The long-term indicator has moved slightly into positive territory. That's not enough to signal a market reversal, but when it gets into its upper range we should expect an end to the correction.
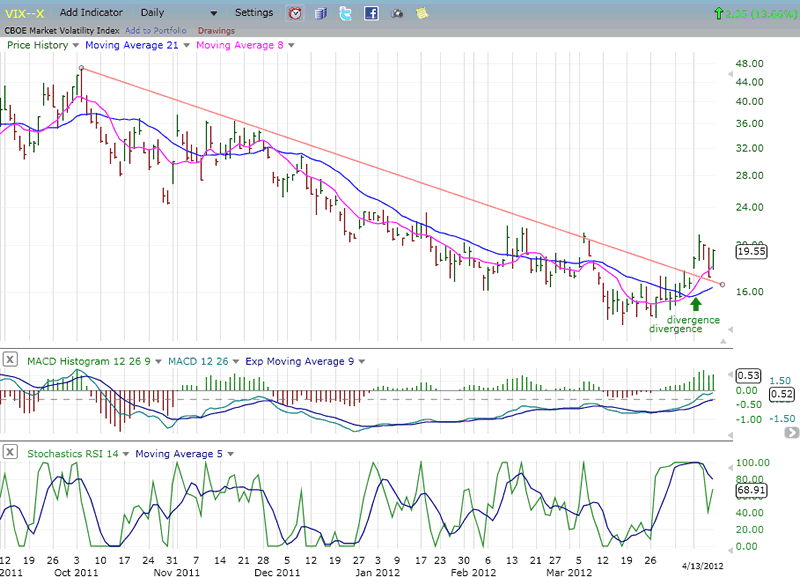
VIX
The VIX broke out of its downtrend after showing some positive divergence to the SPX, breaking its trend line just about the same time as the equity indices broke theirs. Since then, it has back-tested its trend line and appears ready to resume its uptrend as the SPX resumes its downtrend. The lower indicator may be suggesting that additional consolidation is not too far ahead.
On the near-term, the VIX has a P&F count to 21, which could be followed by a move to 25.
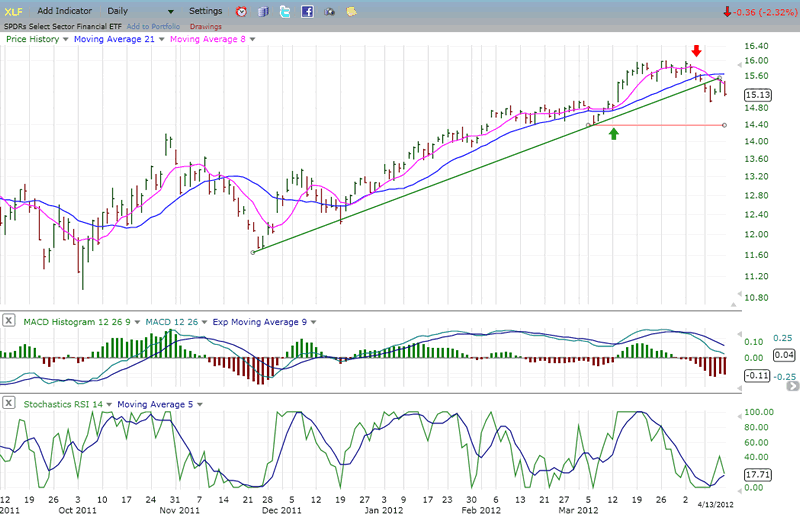
XLF (Financial SPDR)
Over the short-term, there is very little difference between the daily chart of the XLF and that of the SPX. Both broke their trend lines at about the same time, and both are at about the same stage of their decline. The value of this index is that it confirms the SPX trend, often providing some lead warning. It is not so easy to see on the chart, but this happened again on the third peak of the topping pattern; the SPX made a slight new high, but the XLF did not. It shows up better in the indicators which turned down earlier than those of the SPX. I don't know if they will give the same advance notice when a rally is about to occurr, but we shoud be on the watch for it.
The P&F chart projects an initial move to 14.50, which would put it on the red trend line corresponding to the SPX 1340.
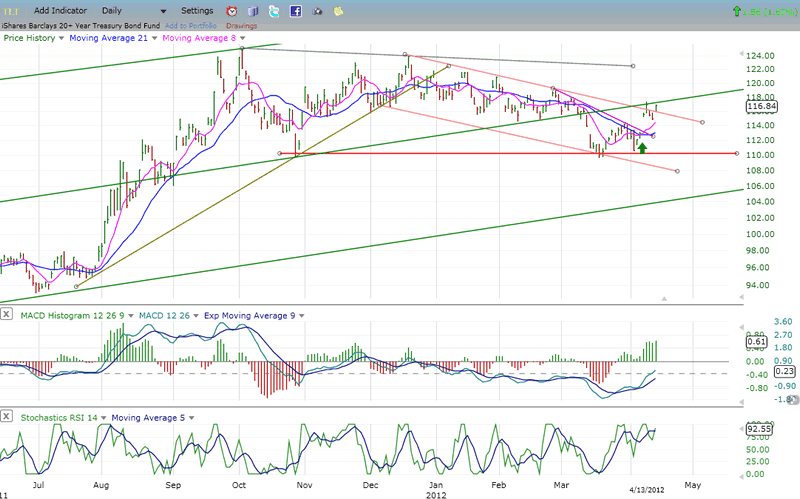
BONDS
A pretty good case can be made that bonds have topped out, but this will require more confirmation. TLT broke an intermediate uptrend line and went into a short-term decline, finding support at a previous low, and now trying to move out of its downtrend channel. However, during its decline, it broke below a mid-channel support line which is now acting as resistance. The indicators have not yet given a sell signal and, with the market ostensibly ready to make new lows, it may successfully move above the resistance line.
However, considerable resistance also comes from the lower range of its distribution area, and the P&F chart only calls for a move to 117 at this time, which has already been reached. In spite of all that, if the SPX has a protracted decline for the next six weeks, it is not likely that TLT will remain below 18.
Let's see what develops over the near term.
UUP (Dollar ETF) Daily Chart.
UUP broke out of an intermediate downtrend in September of last year and has been rising slowly ever since. In spite of its difficult climb from the bottom, it remains in an uptrend, seemingly establishing another accumulation area at a higher level, well above the bottom trend line.
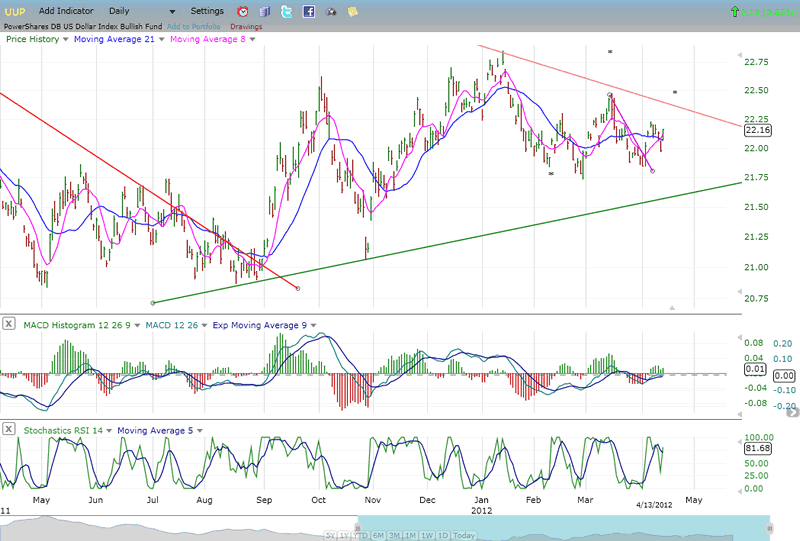
During the formation of that secondary base, the MACD has remained constructive. If UUP can move above the next trend line drawn from the April 2010 top (upper red line), it should also be able to clear the former short-term tops and make a new high.
The base pattern established between May and August of last year carries a P&F potential to 25 for UUP, which is the equivalent of 90 for the US dollar.
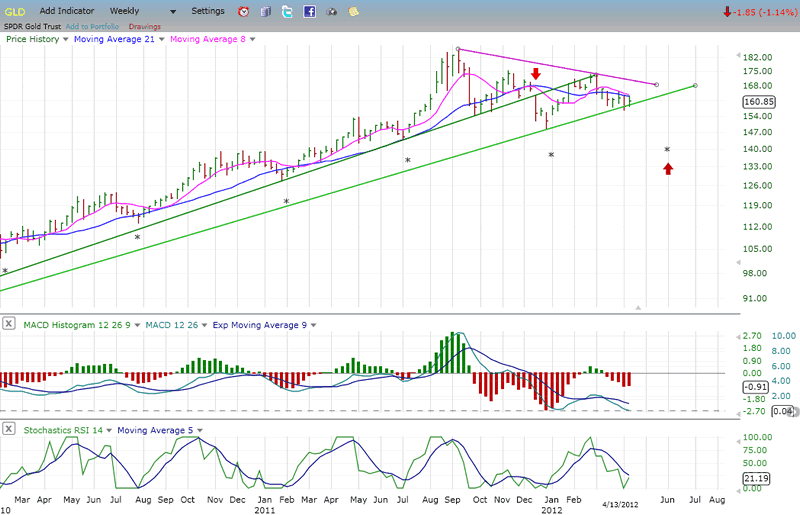
GLD (ETF for gold)
Since reaching its long-term projection of 186 and breaking an important trend line, GLD has been in an intermediate correction which could extend if it breaks an already violated secondary uptrend line. This is a weekly chart, but on the daily chart, the index is also resting on its 200-DMA, and that puts it in a precarious position unless it can quickly start an uptrend. Right now, GLD has been meeting resistance from the declining 21-wk MA. Also, it looks as if the shorter 8-wk MA is about to cross the longer average on the downside (which would occur if there was a close below the recent low).
The indicators are non-committal since they have not yet decisively turned up, and they too would require some upward price movement in order to avoid making new lows, especially the MACD.
GLD appears to be on a fairly regular 25-wk cycle which bottoms again in early June. There is also a 9-wk pattern bottoming at the end of the month. These two cycles are scheduled to make their lows at the same time as those affecting the SPX. If GLD follows the path of the equity indices, this may not be the time to be bullish on gold.
If the index does start down from here, it has a potential move to about 140-145.
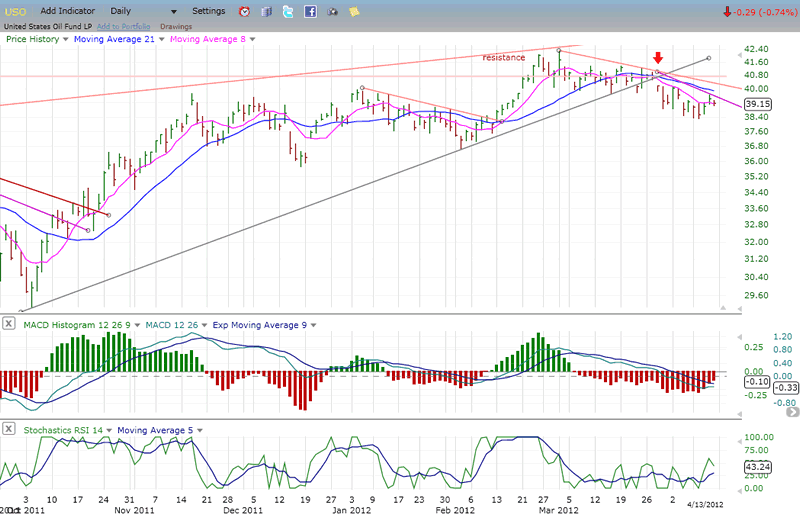
OIL (USO)
Since USO has been rising with the stock market from its October low, it is no coincidence that it, too, should have broken an important trend line at the same time that the major indices did. It made its high in early March, about a month earlier than the SPX - which should have been a warning - and started to decline, hardly pausing at the trend line. It would now appear that the decline may accelerate if there is more weakness in the overall market.
The amount of distribution made at the 41 level is calling for a move down to 35 before its correction is over. This would ostensibly correspond with the market low.
Summary
Although it has not yet been 100% confirmed, the SPX and other equity indices appear to have started a correction which has the potential of taking them to substantially lower levels.
The minimum extent of the decline for the SPX would be to 1340, but if that level is broken, there is a potential move down to about 1300, and perhaps even lower to 1242.
The correction could last until early June.
FREE TRIAL SUBSCRIPTON
If precision in market timing for all time frames is something which is important to you, you should consider a trial subscription to my service. It is free, and you will have four weeks to evaluate its worth.
For a FREE 4-week trial. Send an email to: ajg@cybertrails.com
For further subscription options, payment plans, and for important general information, I encourage you to visit my website at www.marketurningpoints.com. It contains summaries of my background, my investment and trading strategies and my unique method of intra-day communication with Market Turning Points subscribers.
By Andre Gratian
MarketTurningPoints.com
A market advisory service should be evaluated on the basis of its forecasting accuracy and cost. At $25.00 per month, this service is probably the best all-around value. Two areas of analysis that are unmatched anywhere else -- cycles (from 2.5-wk to 18-years and longer) and accurate, coordinated Point & Figure and Fibonacci projections -- are combined with other methodologies to bring you weekly reports and frequent daily updates.
“By the Law of Periodical Repetition, everything which has happened once must happen again, and again, and again -- and not capriciously, but at regular periods, and each thing in its own period, not another’s, and each obeying its own law … The same Nature which delights in periodical repetition in the sky is the Nature which orders the affairs of the earth. Let us not underrate the value of that hint.” -- Mark Twain
You may also want to visit the Market Turning Points website to familiarize yourself with my philosophy and strategy.www.marketurningpoints.com
Disclaimer - The above comments about the financial markets are based purely on what I consider to be sound technical analysis principles uncompromised by fundamental considerations. They represent my own opinion and are not meant to be construed as trading or investment advice, but are offered as an analytical point of view which might be of interest to those who follow stock market cycles and technical analysis.
Andre Gratian Archive |
© 2005-2022 http://www.MarketOracle.co.uk - The Market Oracle is a FREE Daily Financial Markets Analysis & Forecasting online publication.