


Stocks Bull Market Ahead: Indicators Read Warp Speed Eight
Stock-Markets / Stock Market Valuations Jan 21, 2008 - 04:41 PM GMTBy: Joseph_Dancy

 With talk of a serious U.S. economic recession now being commonly heard on every corner, and with the massive write-offs now being taken in the financial sector soon to be followed by massive layoffs, it is a difficult time to be invested in the market. Volatility has been extreme, and we expect that will remain so for the first quarter of 2008. But our indicators point to the fact that later in the year we could see some very positive trends for investors.
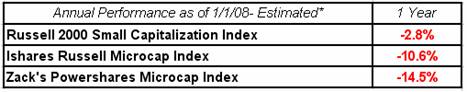 Keep in mind that last year was a very poor year for small capitalization stocks. In fact, in general the smaller the company the worse the stock performed.
Large cap stocks are now catching the performance sickness that infected the smaller companies in 2007. But unlike the small cap sector which is generally ignored, larger firms have a much larger following on Wall Street and are more closely followed by the central bankers who are trying to gauge economic strength.
Going forward we expect both the small and large cap markets will be volatile in 2008. But in the end we think large company stocks will do well – and small companies will do even better - especially companies with exposure to the energy and agricultural sectors. Global demand for energy, grain, and biofuels continues to increase at an impressive rate even as we see a severe contraction in the U.S. real estate and financial sectors.
While it is impossible to know where the market is headed, we track certain indicators that might give us a clue as to the market's direction. Some of these charts are exhibiting extreme readings lately, so we thought they would be worth sharing with our investors.
 IBES Model. Last week the IBES valuation model, also referred to as the “Fed Model”, recorded the most bullish reading in 28 years. The IBES valuation model compares the 12-month forward estimated earnings yield of companies in the Standard & Poor's 500 index to the current yield of the 10-year Treasury note.
According to this model t he U.S. stock market is 52% undervalued – a valuation we would categorize as “extreme”. Historically the IBES model has done a relative good job in forecasting long term market trends and entry and exit points.
Either the IBES model is broken due to the ongoing financial stress on the economic system, or alternatively it is signaling this could an attractive time to invest in the market for those with a longer term outlook.
 Gambill Oscillator. Another measure of interest is the “Gambill Oscillator” – a measure of insider interest in buying stocks. Insiders presumably have a good perspective of when their stocks are undervalued.
When insider purchases exceed 25% of insider sales the Oscillator considers this a strong buy signal.
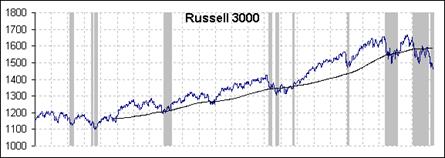
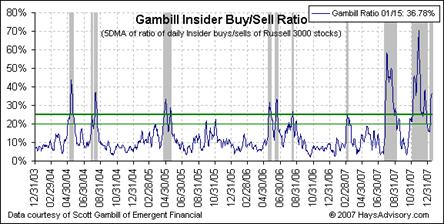 Since 2002, when this indicator was first created, whenever the Oscillator generated a strong buy signal the stock market as measured by the Russell 3000 has been up over 10% in the following six months and up 22% over the next year.
The Oscillator is now well into the strong buy zone.
AAII Survey. The American Association of Individual Investors has been compiling a sentiment poll of its members since 1987. Their most recent release of survey results indicate the three week average of bears to bulls increased to 242%. This is an extraordinarily rare - and bullish - level for this indicator.
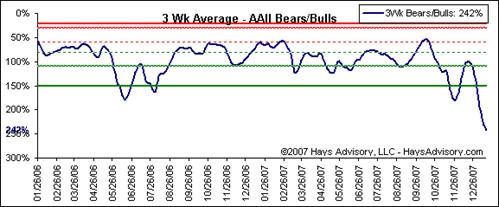 The last time the indicator flashed a reading over 200% was on the week ending February 27, 2003 – and the market as measured by the S&P 500 index advanced 36.6% over the next 12 months.
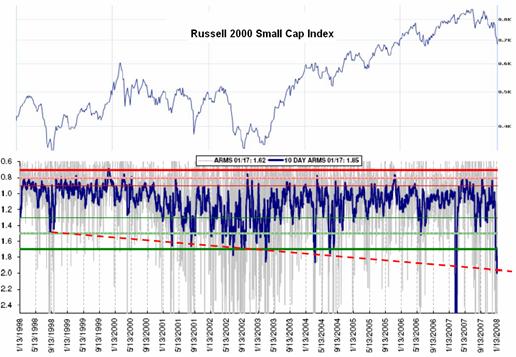
Small companies did even better, with the Russell 2000 small cap index advancing 63.2% in the following 12 month period – and the LSGI micro-cap index increased approximately 143%.
Historically, in the 20 year history of the AAII sentiment indicator, we find that twelve months after a reading in excess of 200% the S&P 500 has advanced an average 21.75% - with no instances of declines.
Monetary Policy. The Federal Reserve is expected to continue to ease monetary policy, which has been very positive for stocks historically. In the 14 easing cycles since 1954, the S&P 500 was higher one year later in all but one instance. The exception was in 2001 due to the Sept. 11 terrorist attacks. The average gain for stocks during the 12 months after the first rate cut was 18.8%.
ARMS Index. The ARMS Index is a measure of price and volume swings in the markets. Developed in 1967, the formula and calculations are somewhat complex, but the concept is that when we see ‘panic selling' in the markets the ARMS Index will register readings above 1.7. For only the 6 th time in the last decade we now have a bullish reading above 1.7.
Examining the signals issued in the last decade, we find that the Russell 2000 index has been up on average 24% twelve months after the 1.7 buy signal is triggered. Measured by the month-end LSGI micro-cap index value after the buy signal issued, we find the average gain twelve months later was 86%.
Keep in mind the ARMS Index buy signals as well as the other buy signals were generated in a general bull market, with up-trending averages. In a long term down-trending bear market the results could be much different.
Meanwhile, the long term trends in the energy and agriculture sectors remain attractive as can be seen in the price of wheat and crude oil. We retain large positions in companies operating in both sectors, the
relationship of supply and demand for energy and agriculture products has seldom been more compelling.
Summary
The last few months have been incredibly brutal months to be invested in the stock market. The news of impeding doom, bankruptcies, potential recessions or even depressions is echoing around the financial press.
While such reports may or may not have a grain of truth to them certain market indicators are flashing long term table pounding buy signals. If they hold true to past performance the market will be flying at warp speed eight by year end.
By Joseph Dancy,
Adjunct Professor: Oil & Gas Law, SMU School of Law
Advisor, LSGI Market Letter
Email: jdancy@REMOVEsmu.edu
Copyright © 2008 Joseph Dancy - All Rights Reserved
Joseph R. Dancy, is manager of the LSGI Technology Venture Fund LP, a private mutual fund for SEC accredited investors formed to focus on the most inefficient part of the equity market. The goal of the LSGI Fund is to utilize applied financial theory to substantially outperform all the major market indexes over time.
He is a Trustee on the Michigan Tech Foundation, and is on the Finance Committee which oversees the management of that institutions endowment funds. He is also employed as an Adjunct Professor of Law by Southern Methodist University School of Law in Dallas, Texas, teaching Oil & Gas Law, Oil & Gas Environmental Law, and Environmental Law, and coaches ice hockey in the Junior Dallas Stars organization.
He has a B.S. in Metallurgical Engineering from Michigan Technological University, a MBA from the University of Michigan, and a J.D. from Oklahoma City University School of Law. Oklahoma City University named him and his wife as Distinguished Alumni.
Joseph Dancy Archive |
© 2005-2022 http://www.MarketOracle.co.uk - The Market Oracle is a FREE Daily Financial Markets Analysis & Forecasting online publication.