


Gold and Gold Miners Are Closing in on a Major Bottom
Commodities / Gold & Silver Stocks May 14, 2012 - 01:57 AM GMTBy: J_W_Jones

 "You can't understand what lays ahead if you don't understand the past" ~ Satellite, Rise Against
Members of my service as well as long time readers know that I do a lot of analysis based on the past. I am constantly looking at long-term historical price charts and data. As a trader, I am always looking for an edge.
Obviously the keys to long-term success involve proper position sizing, risk management mechanisms, and ultimately leveraging probability. Professional traders are masters of these tenets. These characteristics are what separate successful traders from average traders over the long haul.
Sometimes through my rigorous analysis I come across price charts and oscillators that help put together a picture that helps shape my view of the marketplace. The past few months have been some of the most difficult market conditions that I have seen in some time.
The "wall of worries" permeates the financial landscape as risk at present seems unprecedented. The list of macroeconomic concerns ranges from the European sovereign debt crisis to escalation of military action in the Middle East.
I could probably write an entire article about the various risks that plague global financial markets at present, but I try to focus on the positive in any situation. Right now remaining optimistic is a daily battle amid the constant barrage of depressed economic data. Instead of focusing on all of the various risks, I focus on finding opportunities where probabilities are favorable based primarily on historical price data, cycle analysis, and tape reading.
Back on April 9th I proffered an article that discussed my expectation that the U.S. Dollar Index would rally while risk assets such as equities and oil prices would collapse. Additionally I commented on my expectations for weakness in gold, silver, and the entire mining complex. I was wrong about the timing of the U.S. Dollar's advance, but the ultimate price action analysis was correct.
The following quote came from that article, "As shown above, I believe that short term targets to the downside are likely somewhere in the 1,475 - 1,525 price range. I think gold will find a major bottom near these levels and a strong bounce will play out." (Click here to view the entire article)
When I originally wrote that article referring to a decline in gold prices gold futures were trading around 1,630 an ounce. Price rallied sharply higher after my article went public, but fast forward to today and my concerns appear to be well founded. I am a long-term gold bull and I ultimately believe that new highs will occur in the future. However, gold and gold miner's may have further to fall before they find major support.
As stated above, my original expectations for the Dollar Index did not happen in the time frame I was anticipating. However, the belief that a rally was forthcoming proved to be accurate as can be seen from the price chart of the U.S. Dollar Index shown below.
U.S. Dollar Index Daily Chart
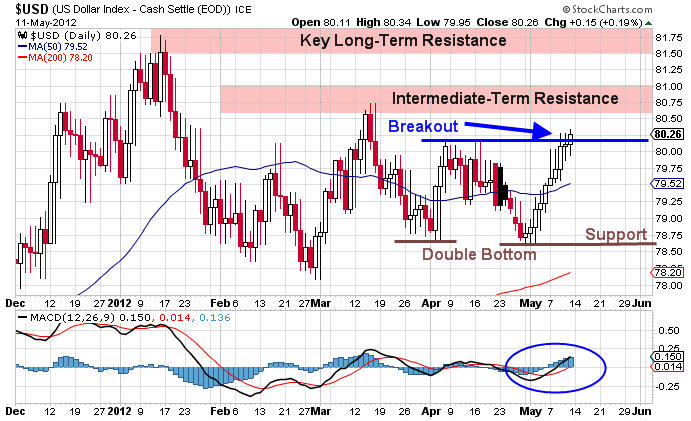
As can be seen above, the price action is confirming serious strength. The weekly close on Friday saw the Dollar close above a key short-term resistance level. Additionally I would point out the double bottom that has been carved out on the chart above which is also bullish. Should resistance near 80.76 give way to higher prices a test of the recent highs is quite possible.
The technical picture suggests higher prices in the near term for the greenback. From a fundamental viewpoint, recent economic data also suggests that higher prices may await as one the largest weekly debt issuance of 2012 among sovereigns within the Eurozone will transpire next week. If any of the debt auctions go poorly it will reflect negatively on the Euro currency and help push the Dollar higher.
Most of the debt issuance is outside of the 3 year maturity window so the LTRO justification to encumber risk does not apply. Next week we will find out just how serious investors are about accepting default risk on European debt instruments. I would be shocked if the ECB sits idly by, but the sheer amount of capital required to safeguard debt issuance next week is extreme, even for a major central bank.
The Euro currency continues to fall and has broken key resistance around the 1.30 price level on the EUR/USD currency pair. Price is not collapsing as of yet, but we are seeing a slow and steady slog lower for the Euro. This price action serves to boost the Dollar which ultimately places downward pressure on risk assets such as equities and oil. Additionally, it reduces the valuation of gold. The daily chart of gold futures is shown below.
Gold Futures Daily Chart
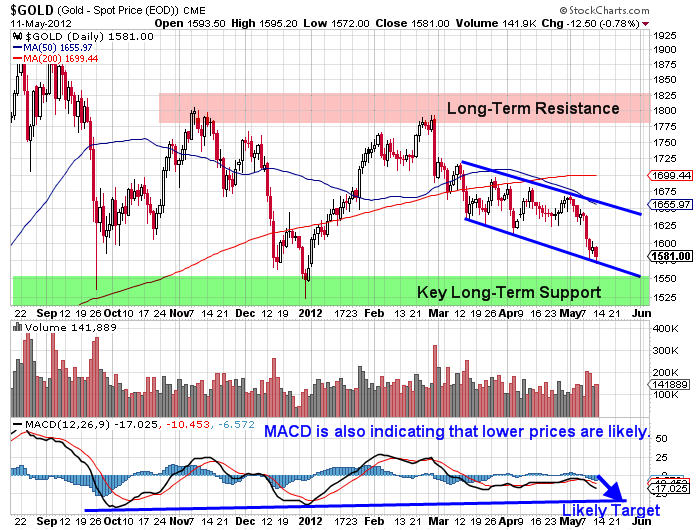
The recent price action in gold has been quite ugly and price is resting at key support stemming from an intermediate-term descending channel shown above. Should the lower bound break to the downside a sharp move lower could play out.
It is important to remember that gold is coming off a monster multi-year bull run and it only serves to make sense that a nasty pullback that shakes out the bulls would be forthcoming. I continue to believe that strong support and buyers will come back into gold around the 1,450 - 1,550 price range as significant long-term support levels should hold up prices. The key support zone is clearly illustrated in the chart above.
I continue to wait for price to reach that key support level and based on the current proximity those support levels are magnetizing price toward them. When long-term support / resistance levels are near price a test is a common occurrence. The most important question to ask is whether the support zone shown above will hold, or will even lower prices ultimately play out?
Gold and silver both are starting to become oversold on the daily time frame. While the gold bugs have been feeling pain the past few weeks, the gold miners have been taken out back to the woodshed for a good whipping. The miners have been absolutely crushed in 2012 .
My long term analysis revealed something quite extraordinary on the longer term weekly chart of the HUI gold mining index which I believe is critical for readers to watch and monitor. We are nearing valuation levels based on the true strength index that have not been seen since the market crash that took place back in 2008. The weekly chart of the gold bugs index is shown below.
Gold Bugs Index Weekly Chart
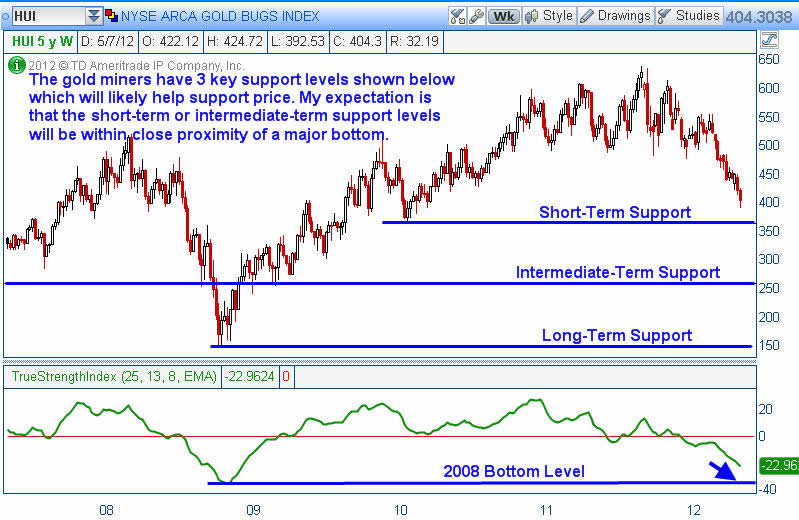
As can be seen above, the Gold Bugs Index (HUI) has been under considerable selling pressure since early September of 2011. However, note how low the True Strength Index is based on 5 years of price data. We are nearing the same level that we saw back in 2008 which marked a major bottom that ultimately resulted in a monster move to the upside for the gold miners.
I am of the opinion that this chart demonstrates quite clearly that a great buying opportunity for gold, silver, and the miners is likely going to present itself in the near future. I will be watching this price relationship over the next few weeks waiting for a strong entry point for a longer-term purchase. After this pullback concludes, the potential returns that could occur in gold, silver, and the miners could be breathtaking.
With 3 clear support levels, a defined risk approach could be used in order to scale in or to reduce market risk should prices continue to move below each support level. While the time is not right just yet, more than likely a solid long-term risk / reward trade may very well present itself in the precious metals and mining space. I am likely a bit early, but the ultimate end game as it relates to fiat currency is documented throughout history. The final result has a finality that few truly comprehend.
Happy Trading and Investing!
 If you are looking for a simple one trade per week trading style then be sure to join www.OptionsTradingSignals.com today with our 14 Day Trial.
J.W. Jones is an independent options trader using multiple forms of analysis to guide his option trading strategies. Jones has an extensive background in portfolio analysis and analytics as well as risk analysis. J.W. strives to reach traders that are missing opportunities trading options and commits to writing content which is not only educational, but entertaining as well. Regular readers will develop the knowledge and skills to trade options competently over time. Jones focuses on writing spreads in situations where risk is clearly defined and high potential returns can be realized.
This article is intended solely for information purposes. The opinions are those of the author only. Please conduct further research and consult your financial advisor before making any investment/trading decision. No responsibility can be accepted for losses that may result as a consequence of trading on the basis of this analysis.
© 2005-2022 http://www.MarketOracle.co.uk - The Market Oracle is a FREE Daily Financial Markets Analysis & Forecasting online publication.