


Have Small Cap Stocks Bottomed Or Further to Fall?
Stock-Markets / Stock Markets 2012 May 24, 2012 - 01:53 AM GMTBy: David_Banister

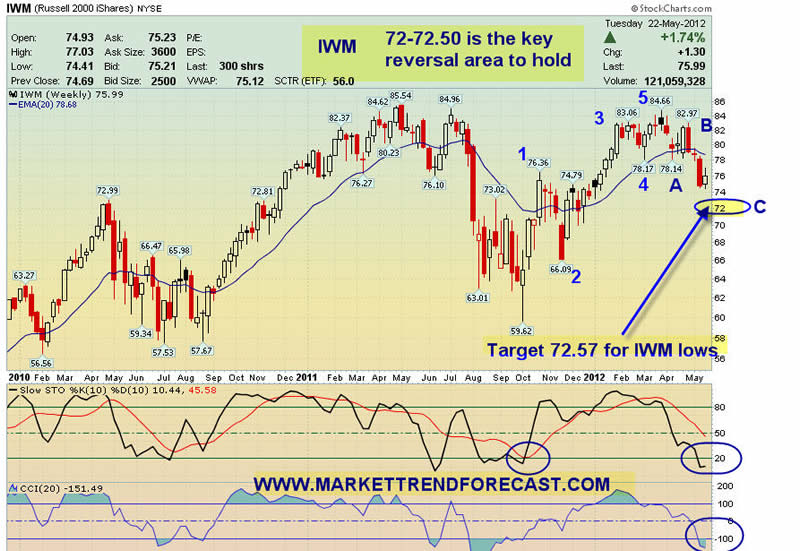
The IWM ETF represents the Russell 2000 small cap growth index. This ETF peaked at 84.66 this spring and has fallen in the the 74′s before the recent two day bounce. What we are looking at is a possible 5 wave rally from October into March, and now a possible 3 wave correction (Wave 2) of 38-50% of that entire 5 wave rally. Elliott Wave theory is broken down into 5 wave and 3 wave movements in the markets and individual stocks, where a full 5 wave pattern in a Bull market is obviously bullish and a 3 wave pattern corrective of the prior 5 wave rally.
The small cap index peaked with the reset of the market in March of this year, interestingly about 3 years into the Bull Market. The first low so far was a typical 38% fibonacci retracement of the rally from October through early March. The next low pivot would be a 50% pullback. This would place the IWM target around 72.10 plus minus some pennies.
In the 72′s that would represent a C wave decline that is equivalent to 161% of the A wave decline in the chart below from the 84.66 highs. ABC declines are common in a Bull cycle and are designed to throw investors off the back of the Bull. Normally the C wave is where investors finally throw in the towel near the bottom, as we saw in early October of 2011. I wrote an article on October 3rd last year, one day before the bottom outlining why a massive rally was about to ensue. Will we see the same thing now?
Well, this correction could indicate one more possible decline of 4-5% worst case should this projection in the chart below fulfill.
That said, the 38% retracement we have had so far would also qualify as a Wave 2 low last Friday. Therefore, this outline is to give you some indications of what to watch in case we drop further and pierce those lows. If we can hold this rally and rebound smartly again, then the C wave of the ABC is likely over and we can get an all clear to be more aggressive.
Join us at www.markettrendforecast.com for weekly reports and or a subscription and a 33% discount!
Dave Banister
CIO-Founder
Active Trading Partners, LLC
www.ActiveTradingPartners.com
TheMarketTrendForecast.com
Dave Banister is the Chief Investment Strategist and commentator for ActiveTradingPartners.com. David has written numerous market forecast articles on various sites (SafeHaven.Com, 321Gold.com, Gold-Eagle.com, TheStreet.Com etc. ) that have proven to be extremely accurate at major junctures.
© 2012 Copyright Dave Banister- All Rights Reserved
Disclaimer: The above is a matter of opinion provided for general information purposes only and is not intended as investment advice. Information and analysis above are derived from sources and utilising methods believed to be reliable, but we cannot accept responsibility for any losses you may incur as a result of this analysis. Individuals should consult with their personal financial advisors.
© 2005-2022 http://www.MarketOracle.co.uk - The Market Oracle is a FREE Daily Financial Markets Analysis & Forecasting online publication.