


Trading Markets with the Two-Bar Pop Gun Trading Pattern
InvestorEducation / Learn to Trade Sep 25, 2012 - 12:47 PM GMTBy: EWI

 Some people like to get outside on the weekends, maybe playing tennis or working in the yard. Some people like to visit their friends or cook a big meal or go out to see a movie. And some people who are passionate about their work -- such as Elliott Wave International's (EWI) analyst Jeffrey Kennedy -- like to stare at hundreds of price charts on their computer screen to find patterns that point to trade setups. We used to worry for his health but not anymore, because he's been doing it for years and he comes up with some amazing trading lessons. Enjoy this lesson on bar patterns from EWI analyst Jeffrey Kennedy.
[Editor's note: Elliott Wave International is hosting Trader Education Week, September 26 through October 3. During this event, analyst Jeffrey Kennedy will share video trading lessons that will empower you to improve the way you trade.]
The Popgun I'm no doubt dating myself, but when I was a kid, I had a popgun -- the old-fashioned kind with a cork and string (no fake Star Wars light saber for me). You pulled the trigger, and the cork popped out of the barrel attached to a string. If you were like me, you immediately attached a longer string to improve the popgun's reach. Why the reminiscing? Because "Popgun" is the name of a bar pattern I would like to share with you this month. And it's the path of the cork (out and back) that made me think of the name for this pattern.
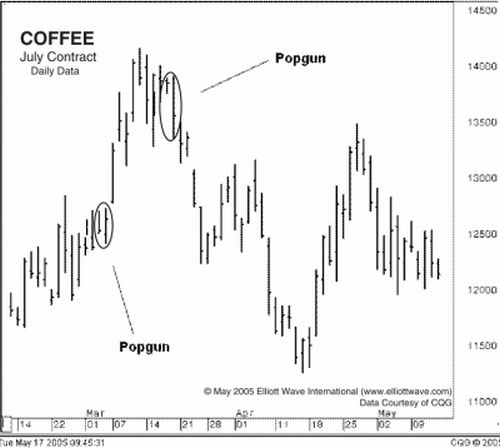
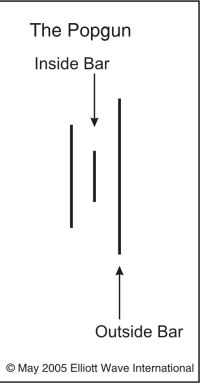
The Popgun is a two-bar pattern composed of an outside bar preceded by an inside bar. (Quick refresher course: An outside bar occurs when the range of a bar encompasses the previous bar and an inside bar is a price bar whose range is encompassed by the previous bar.) In Chart 1 (Coffee), I have circled two Popguns.
So what's so special about the Popgun? It introduces swift, tradable moves in price. More importantly, once the moves end, they are significantly retraced, just like the popgun cork going out and back. As you can see in Chart 2 [not shown], prices advance sharply following the Popgun, and then the move is significantly retraced. In Chart 3 [not shown], we see the same thing again but to the downside: prices fall dramatically after the Popgun, and then a sizable correction develops.
How can we incorporate this bar pattern into our Elliott wave analysis? The best way is to understand where Popguns show up in the wave patterns. I have noticed that Popguns tend to occur prior to impulse waves -- waves one, three and five. But, remember, waves A and C of corrective wave patterns are also technically impulse waves. So Popguns can occur prior to those moves as well.
As with all my work, I rely on a pattern only if it applies across all time frames and markets. To illustrate, I have included two charts of Sirius Satellite Radio (SIRI) that show this pattern works equally well on 60-minute and weekly charts. Notice that the Popgun on the 60-minute chart [not shown] preceded a small third wave advance. Now look at the weekly chart [not shown] to see what three Popguns introduced (from left to right), wave C of a flat correction, wave 5 of (3) and wave C of (4).
There's only one more thing to know about using this Popgun trade setup: Just be careful and don't shoot your eye out, as my mom would say.
|
A FREE trading event that will teach you how to spot trading opportunities in your charts Elliott Wave International is hosting a free Trader Education Week, Sept. 26 through Oct. 3. Register now and get instant access to 4 free trading resources from EWI analyst Jeffrey Kennedy -- plus you'll receive more lessons from Jeffrey as they're unlocked each day of the event. |
This article was syndicated by Elliott Wave International and was originally published under the headline A Two-Bar Pattern that Points to Trade Setups. EWI is the world's largest market forecasting firm. Its staff of full-time analysts led by Chartered Market Technician Robert Prechter provides 24-hour-a-day market analysis to institutional and private investors around the world.
Best Regards,
About the Publisher, Elliott Wave InternationalFounded in 1979 by Robert R. Prechter Jr., Elliott Wave International (EWI) is the world's largest market forecasting firm. Its staff of full-time analysts provides 24-hour-a-day market analysis to institutional and private investors around the world.
© 2005-2022 http://www.MarketOracle.co.uk - The Market Oracle is a FREE Daily Financial Markets Analysis & Forecasting online publication.