


Manipulated U.S. Jobs Report Good for Obama
ElectionOracle / Unemployment Nov 02, 2012 - 12:48 PM GMTBy: Mike_Shedlock

 Initial Reaction and Election Impact
The establishment report of +171,000 jobs was above what most expected. Hurricane Sandy had no effect. The BLS finished gathering stats before the hurricane hit. This report will likely be viewed as favorable for the president.
On the surface, and in detail, this is the best jobs report in quite a while. Jobs gained were full-time jobs for a change. I do not attribute this report to BLS manipulation.
October Jobs Report at a Glance
Here is an overview of today's release.
- Payrolls +171,000 - Establishment Survey
- US Employment +410,000 - Household Survey
- Involuntary Part-Time Work -269,000 - Household Survey
- Involuntary Part-Time Work +582,000 last month - Household Survey
- Baseline Unemployment Rate +.01 at 7.9% - Household Survey
- U-6 unemployment -.01 to 14.6%.
- The Civilian Labor Force +578,000
Quick Notes About the Unemployment Rate
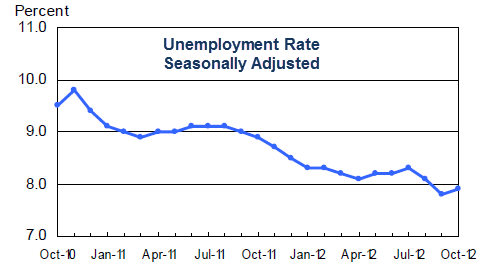
- US unemployment rate +.1 to 7.9%
- In the last three months the unemployment rate dropped .4%
- Those "not" in the labor force fell a second month, last month by 211,000 and this month by 369,000
- In the last year, those "not" in the labor force rose by 2,128,000
- Over the course of the last year, the number of people employed rose by 3,087,000.
- Participation Rate rose .01 to 63.6%
- Long-Term unemployment (27 weeks and over) was 4,844 million a decline of 189,000
- Were it not for people dropping out of the labor force, the unemployment rate would still be well over 10%.
October 2012 Jobs Report
Please consider the Bureau of Labor Statistics (BLS) September 2012 Employment Report.
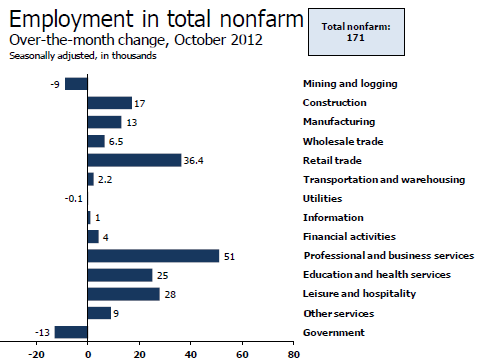
Total nonfarm payroll employment increased by 171,000 in October, and the unemployment rate was essentially unchanged at 7.9 percent, the U.S. Bureau of Labor Statistics reported today. Employment rose in professional and business services, health care, and retail trade.
Click on Any Chart in this Report to See a Sharper Image
Unemployment Rate - Seasonally Adjusted
Nonfarm Employment - Payroll Survey - Annual Look - Seasonally Adjusted
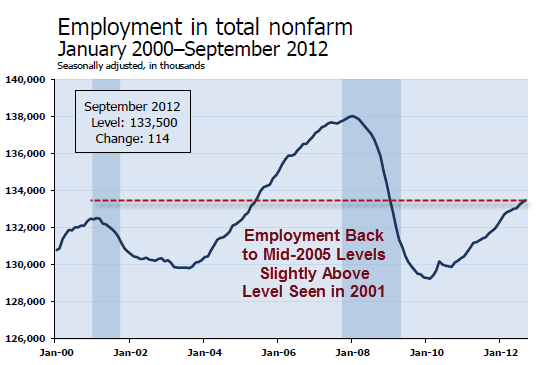
Employment is above the total just prior to the 2001 recession, and about where it was in mid-2005.
Nonfarm Employment - Payroll Survey Monthly Changes - Seasonally Adjusted
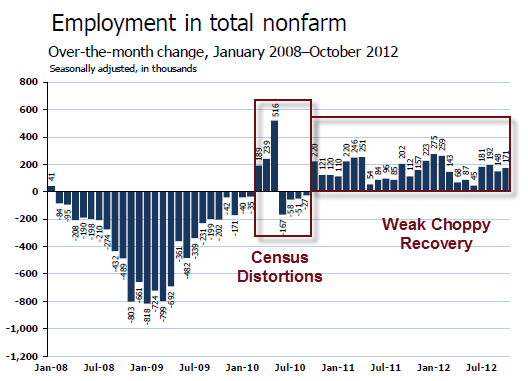
Between January 2008 and February 2010, the U.S. economy lost 8.8 million jobs.
Since the employment low in February 2010, nonfarm payrolls have expanded by about 5.0 million jobs. Of the 8.8 million jobs lost between January 2008 and February 2010, approximately 57% percent have been recovered (not accounting for normal demographics growth)
Statistically, 125,000+- jobs a month is enough to keep the unemployment rate flat. For a discussion, please see Question on Jobs: How Many Does It Take to Keep Up With Demographics?
Since the beginning of the year, job growth has averaged 155,000 per month, compared with an average monthly gain of 175,000 in 2011.
Current Report Jobs
Average Weekly Hours
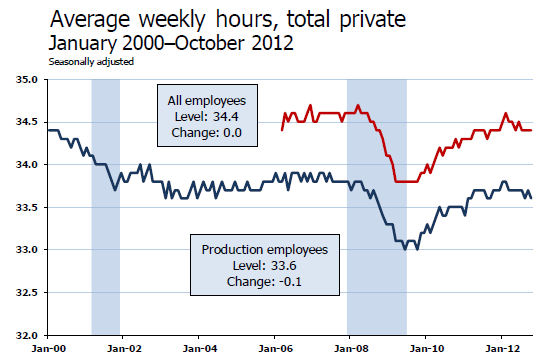
Index of Aggregate Weekly Hours
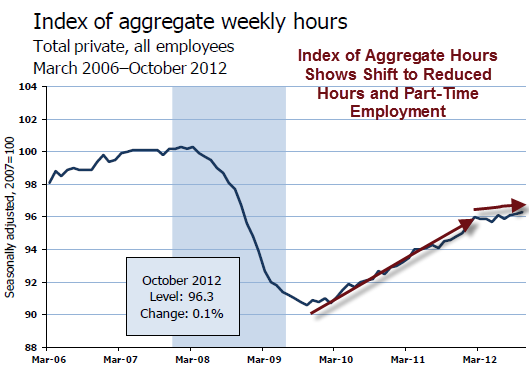
The index of aggregate hours paints a good picture of the stall in the recovery. Employment is up, but hours are not up proportionally. This reflects the trend to part-time workers and the reduction of hours in part-time workers.
Average Hourly Earnings vs. CPI
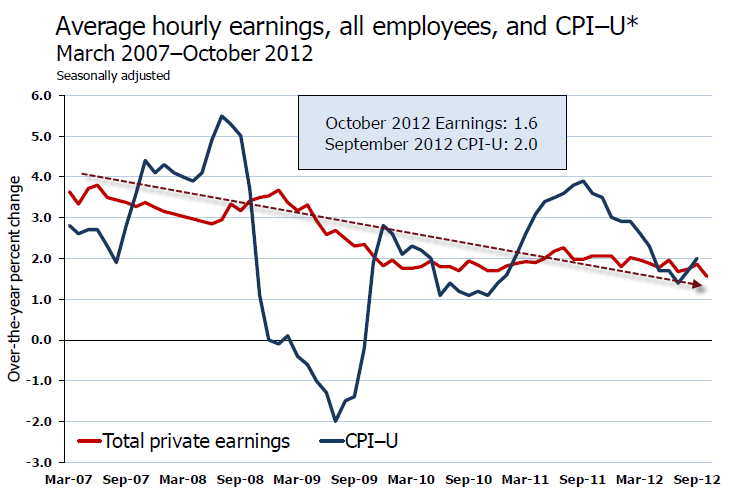
Average hourly earnings has been falling for years and lagging CPI inflation since September 2009. Simply put real wages have been declining. Add in increases in state taxes and the average Joe has been hammered pretty badly.
For further discussion, please see What's "Really" Behind Gross Inequalities In Income Distribution?
BLS Birth-Death Model Black Box
The BLS Birth/Death Model is an estimation by the BLS as to how many jobs the economy created that were not picked up in the payroll survey.
The Birth-Death numbers are not seasonally adjusted, while the reported headline number is. In the black box the BLS combines the two, coming up with a total.
The Birth Death number influences the overall totals, but the math is not as simple as it appears. Moreover, the effect is nowhere near as big as it might logically appear at first glance.
Do not add or subtract the Birth-Death numbers from the reported headline totals. It does not work that way.
Birth/Death assumptions are supposedly made according to estimates of where the BLS thinks we are in the economic cycle. Theory is one thing. Practice is clearly another as noted by numerous recent revisions.
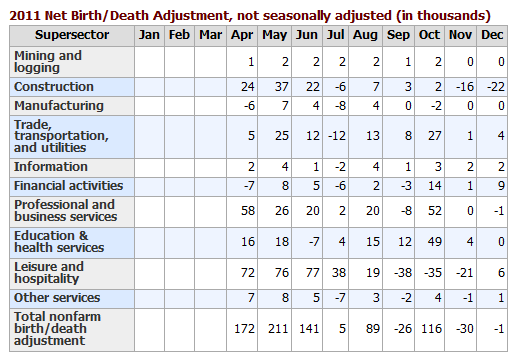
Birth Death Model Adjustments For 2011
Birth Death Model Adjustments For 2012
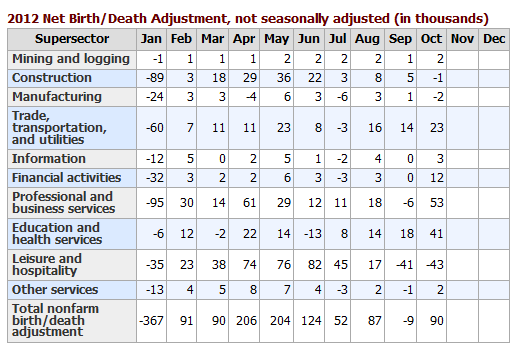
Birth-Death Notes
Once again: Do NOT subtract the Birth-Death number from the reported headline number. That approach is statistically invalid.
Note the historically rare occurrence this month of a negative non-January adjustment.
In general, analysts attribute much more to birth-death numbers than they should. Except at economic turns, BLS Birth/Death errors are reasonably small.
For a discussion of how little birth-death numbers affect actual monthly reporting, please see BLS Birth/Death Model Yet Again.
Household Survey Data
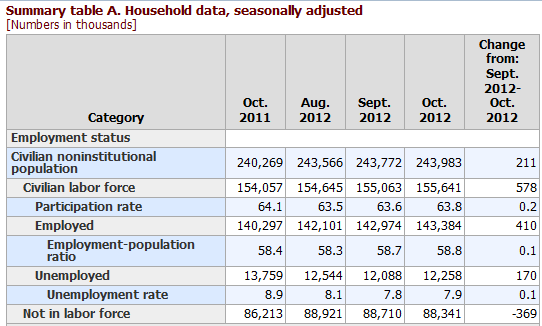
In the last year, the civilian population rose by 3,714,000. Yet the labor force only rose by 1,584,000.
Those not in the labor force rose by 2,128,000 to 88,341,000.
That is an amazing "achievement" to say the least, and as noted above most of this is due to economic weakness not census changes.
Decline in Labor Force Factors
- Discouraged workers stop looking for jobs
- People retire because they cannot find jobs
- People go back to school hoping it will improve their chances of getting a job
- People stay in school longer because they cannot find a job
Were it not for people dropping out of the labor force, the unemployment rate would be well over 10%.
Part Time Status
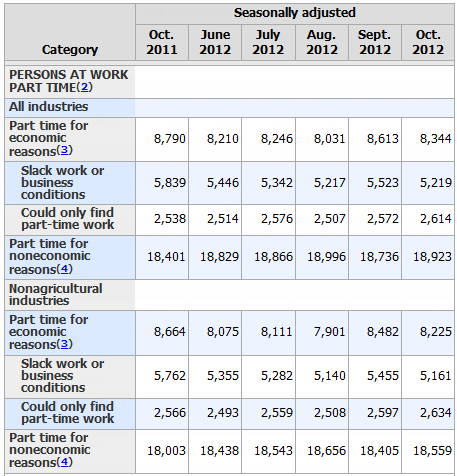
There are 8,344,000 workers who are working part-time but want full-time work. This is a volatile series. This month's decline of 269,000 follows last month's jump of 582,000.
BLS Alternate Measures of Unemployment
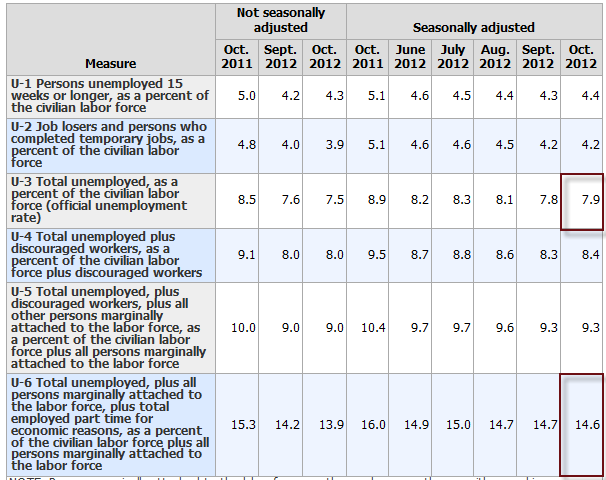
Table A-15 is where one can find a better approximation of what the unemployment rate really is.
Notice I said "better" approximation not to be confused with "good" approximation.
The official unemployment rate is 7.9%. However, if you start counting all the people that want a job but gave up, all the people with part-time jobs that want a full-time job, all the people who dropped off the unemployment rolls because their unemployment benefits ran out, etc., you get a closer picture of what the unemployment rate is. That number is in the last row labeled U-6.
U-6 is much higher at 14.6%. Both numbers would be way higher still, were it not for millions dropping out of the labor force over the past few years.
Duration of Unemployment
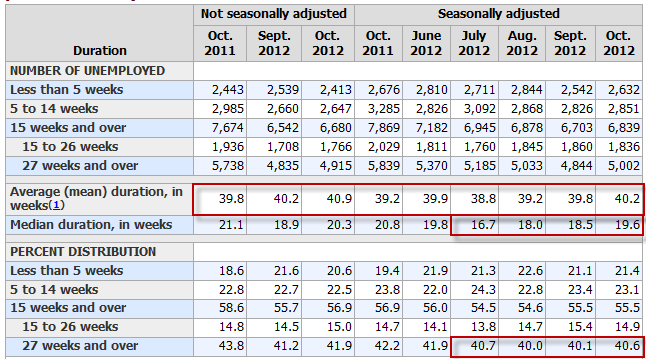
Long-term unemployment remains in a disaster zone with 40% of the unemployed in the 27 weeks or longer category. Median duration of unemplyment has been rising for 3 months while the average has been hovering right around 40 week for a year.
Grossly Distorted Statistics
Given the complete distortions of reality with respect to not counting people who allegedly dropped out of the work force, it is easy to misrepresent the headline numbers.
Digging under the surface, the drop in the unemployment rate over the past two years is nothing but a statistical mirage. Things are much worse than the reported numbers indicate.
Finally, before anyone gets too excited about this jobs report, note that it is just one month, and it may be revised away. Even if not, take another look at the index of aggregate hours and average wages vs. CPI because those charts reflect very important stories not at all seen in the headline numbers.
By Mike "Mish" Shedlock
http://globaleconomicanalysis.blogspot.com
Click Here To Scroll Thru My Recent Post List
Mike Shedlock / Mish is a registered investment advisor representative for SitkaPacific Capital Management . Sitka Pacific is an asset management firm whose goal is strong performance and low volatility, regardless of market direction.
Visit Sitka Pacific's Account Management Page to learn more about wealth management and capital preservation strategies of Sitka Pacific.
I do weekly podcasts every Thursday on HoweStreet and a brief 7 minute segment on Saturday on CKNW AM 980 in Vancouver.
When not writing about stocks or the economy I spends a great deal of time on photography and in the garden. I have over 80 magazine and book cover credits. Some of my Wisconsin and gardening images can be seen at MichaelShedlock.com .
© 2012 Mike Shedlock, All Rights Reserved.
Disclaimer: The above is a matter of opinion provided for general information purposes only and is not intended as investment advice. Information and analysis above are derived from sources and utilising methods believed to be reliable, but we cannot accept responsibility for any losses you may incur as a result of this analysis. Individuals should consult with their personal financial advisors.
© 2005-2022 http://www.MarketOracle.co.uk - The Market Oracle is a FREE Daily Financial Markets Analysis & Forecasting online publication.