


Stocks Bull / Bear Market Inflection Point Nears
Stock-Markets / Stock Markets 2012 Dec 10, 2012 - 03:24 AM GMTBy: Tony_Caldaro

 A choppy market this week in the US which ended quite mixed. For the week the SPX/DOW were +0.55%, but the NDX/NAZ were -1.15%. Asian markets gained 0.8%, European markets gained 1.0%, and the DJ World index was +0.6%. On the economic front positive reports outpaced negative ones 8 to 5. On the uptick: construction spending, productivity, factory orders, ISM services, consumer credit, the WLEI, plus weekly jobless claims and the unemployment rate improved. On the downtick: ISM manufacturing, the ADP index, nonfarm payrolls, consumer sentiment, and investor sentiment. Next week the FED meets tuesday/wednesday, plus we get reports on retail sales, the CPI/PPI, and industrial production. Best to your week!
LONG TERM: bull market nearing inflection point
Our preferred bull market count continues to unfold as generally expected. We have been anticipating this to be Cycle wave [1] of a new multi-decade Supercycle bull market. Cycle wave bull markets unfold in five Primary waves. Thus far Primary waves I and II completed in 2011, and Primary wave III has been underway since that low. Primary wave I divided into five Major waves, with a subdividing Major wave 1. Primary wave III appears to be following the same path, except Major wave 3 is also subdividing. Not unusual for a third wave. Currently Major waves 1 and 2 have completed in 2012, and Major wave 3 has been underway since the Major 2 low at SPX 1267. The technicals, RSI/MACD, continue to display generally bullish patterns. We give this bullish scenario a 70% chance of continuing into 2013.
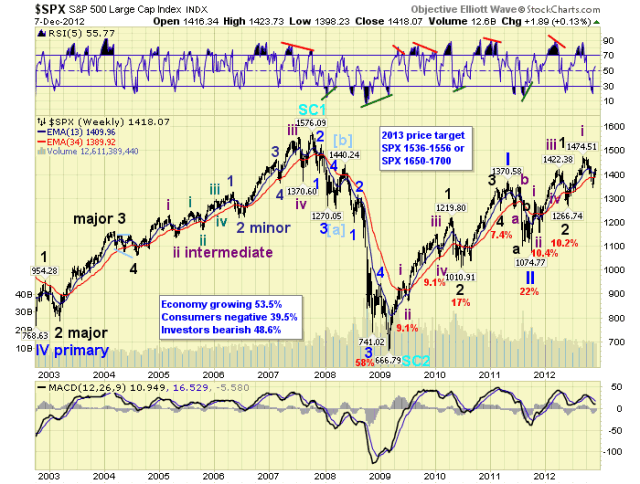
After identifying the March 2009 SPX 667 low - within a couple of days. We expected a bear market rally to retrace at least 50% of the Oct07-Mar09 decline, and reach the SPX 1100′s. After that occurred in January 2010 the market reached an inflection point. When the next downtrend looked corrective, and the market turned higher, we knew we were in a bull market.
In the spring of 2011 the market completed five waves up from the March 2009 low, and began to correct. Since the market had already doubled, in just two years, it reached another inflection point. The correction that followed, 22%, was quite abnormal for a bull market. But the market started impulsing again and eventually made new bull market highs in 2012. Now we are nearing another inflection point.
There is a 30% probability, according to our calculations, that stocks made a bull market high in Sept/Oct 2012 in the form of an elongated diagonal triangle. The chart below displays a five Primary wave, (I thru V), move up from March 2009. But it best counted as a potential ABCDE. Under this alternate scenario, only 30%, the recent downtrend into the mid-November lows was the first wave down of the new bear market. And, the current uptrend a counter-trend rally. As we have noted in the past few weeks, counter-trend rallies, after the first downtrend, retrace between 69% and 90% of the previous decline. This would give this uptrend a price objective between SPX 1434 and 1462. The SPX reached 1424 on monday.
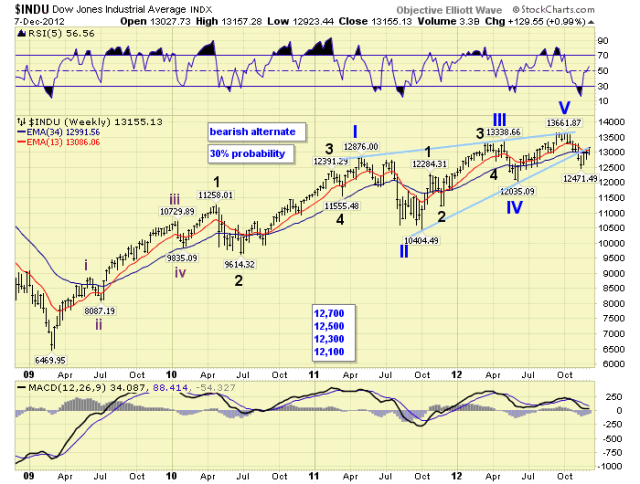
If this alternate scenario is indeed the market’s next path. The current uptrend, once confirmed, should roll over after it enters this range and a new bear market should take hold. If not, the uptrend should continue to new bull market highs. Thus far, this uptrend looks impulsive suggesting the bull market will continue. However, some caution is advisable once this range is reached.
MEDIUM TERM: uptrend highly probable
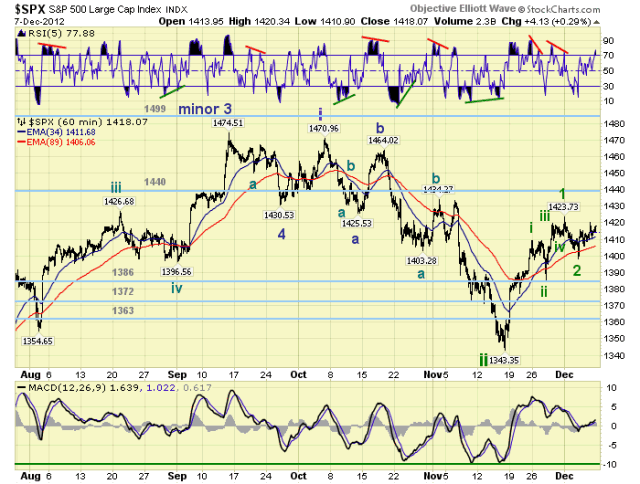
After the market hit our worse case, (SPX 1345/46), correction level in mid-November, the market spiked higher suggesting the downtrend had ended. The correction, 8.9%, was quite normal for this bull market, and the low found support between waves 1 and 2 of a lesser degree. Since that SPX 1343 low the market has rallied to 1424, (6%), in just three weeks.
In the middle of this rally the market generated a WROC buy signal. These signals often occur prior to uptrend confirmations. While we are waiting for the major indices to confirm an uptrend, we continue to observe many positive events. Currently three of the nine SPX sectors we track are now in confirmed uptrends. The level was zero during the downtrend. Also, 65% of the twenty international indices we track are now in confirmed uptrends. During the downtrend that reading was only 10%. The US should have an uptrend confirmation soon. Medium term support remains at the 1386 and 1372 pivots, with resistance at the 1440 and 1499 pivots.
SHORT TERM
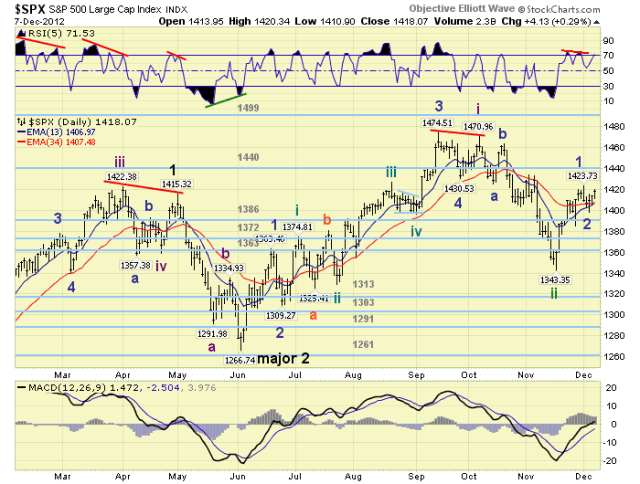
Short term support is at SPX 1413/16 and 1402/03, with resistance at SPX 1422/27 ad the 1440 pivot. Short term momentum ended the week overbought. The short term OEW charts remain positive with the swing level now at SPX 1409.
We have been counting this uptrend as Intermediate wave iii of Major wave 3. The first rally, from SPX 1343-1424, we tentatively labeled as Minor wave 1. We counted five Minute waves up from the low: 1409-1385-1420-1409-1424. Then the market declined to SPX 1398 on wednesday. We are counting this pullback as Minor wave 2. We should be currently in the early stages of a Minor wave 3 rally.
Since Minor 1 advanced 81 points, 1343-1424, Minor 3 should be equal to Minor 1 or possibily 1.618 times Minor 1. If it is equal, we should make new bull market highs around SPX 1480. If it extends to a 1.618 relationship the SPX should reach about 1530.
However, if we are dealing with the 30% probability bear market rally, we have different wave labelings, and a different wave relationship. The rally from SPX 1343-1424 would be labeled wave A, and the pullback wave B. Wave C would now be underway to complete a counter-trend bear market retracement. Under this scenario Wave C is likely to be 0.618 times wave A: SPX 1448. This falls within our SPX 1434-1462 range, and reaches just about within the upper end of the OEW 1440 pivot range.
A quick review of the hourly chart displays a lot of price congestion right around the 1440 pivot too. With the SPX ending the week at 1418, next week may be quite important to the bull/bear inflection point. It just so happens that the FED has its FOMC meeting, concluding on wednesday, Retail sales on thursday, and Industrial production is reported on friday. Stay tuned, this could be quite an important week. Best to your week!
FOREIGN MARKETS
The Asian markets were all higher on the week for a net gain of 0.8%. Only China and Singapore remain in downtrends.
The European markets were mostly higher on the week for a net gain of 1.0%. Greece and Spain remain in downtrends.
The Commodity equity group were mixed on the week for a net gain of 1.3%. Brazil and Canada remain in downtrends.
The DJ World index is uptrending and gained 0.6% on the week.
COMMODITIES
Bonds remain in a choppy uptrend, but lost 0.1% on the week.
Crude is still downtrending and lost 3.0% on the week.
Gold continues to downtrend, losing 0.7% on the week. It made may need to make a lower low.
The USD is downtrending, but gained 0.3% on the week.
NEXT WEEK
Tuesday kicks off the economic week with the Trade deficit and Wholesale inventories. Wednesday: Export/Import prices, the Budget deficit and the FED’s statement. Thursday: weekly Jobless claims, Retail sales, the PPI and Business inventories. On friday: the CPI and Industrial production. As for the FED. There will be a press conference following the FOMC statement on wednesday. Then on friday a Board Meeting on the supervision of foreign banking organizations: http://www.ustream.tv/federalreserve. Best to your weekend, and potentially important week!
CHARTS: http://stockcharts.com/...
http://caldaroew.spaces.live.com
After about 40 years of investing in the markets one learns that the markets are constantly changing, not only in price, but in what drives the markets. In the 1960s, the Nifty Fifty were the leaders of the stock market. In the 1970s, stock selection using Technical Analysis was important, as the market stayed with a trading range for the entire decade. In the 1980s, the market finally broke out of it doldrums, as the DOW broke through 1100 in 1982, and launched the greatest bull market on record.
Sharing is an important aspect of a life. Over 100 people have joined our group, from all walks of life, covering twenty three countries across the globe. It's been the most fun I have ever had in the market. Sharing uncommon knowledge, with investors. In hope of aiding them in finding their financial independence.
Copyright © 2012 Tony Caldaro - All Rights Reserved Disclaimer: The above is a matter of opinion provided for general information purposes only and is not intended as investment advice. Information and analysis above are derived from sources and utilising methods believed to be reliable, but we cannot accept responsibility for any losses you may incur as a result of this analysis. Individuals should consult with their personal financial advisors.
Tony Caldaro Archive |
© 2005-2022 http://www.MarketOracle.co.uk - The Market Oracle is a FREE Daily Financial Markets Analysis & Forecasting online publication.