Natural Gas – Uncovering Trade Potentials
Commodities / Natural Gas Jan 25, 2013 - 11:51 AM GMTBy: Michael_Noonan
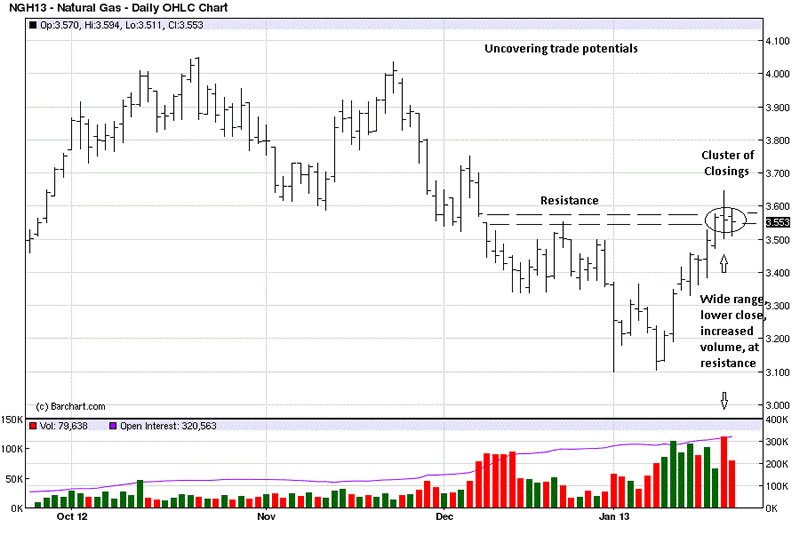
 We like Natural Gas from the long side, ever since the 9 January "double bottom." What was needed was a weak correction, or retest of that day's low, but it never came as price kept rallying higher every day. Last night, while reviewing markets, in general, this chart jumped out for a short-term short position.
The first thing noticed was the wide range bar on Tuesday, second bar from end. The close was weak, just under mid-range the bar, and volume increased. Increased volume on a wide range bar is always worth noting. Turns out, there was also a three day clustering of closes, and all of this occurring at a potential resistance area, noted by the broken horizontal lines where a downside gap formed.
The daily trend is still down, so taking a short position in a down trend makes sense. We knew if there were price weakness during Thursday's trade, it was a reason to go short. All we had to do was monitor intra day activity.

The best part of following developing market activity is that it eliminates guesswork and the need of following opinion, or gut feel. The market provides opportunities all the time. Incorporating a set of rules for taking action when set-ups like these occur puts us in a decided trading edge opportunity.
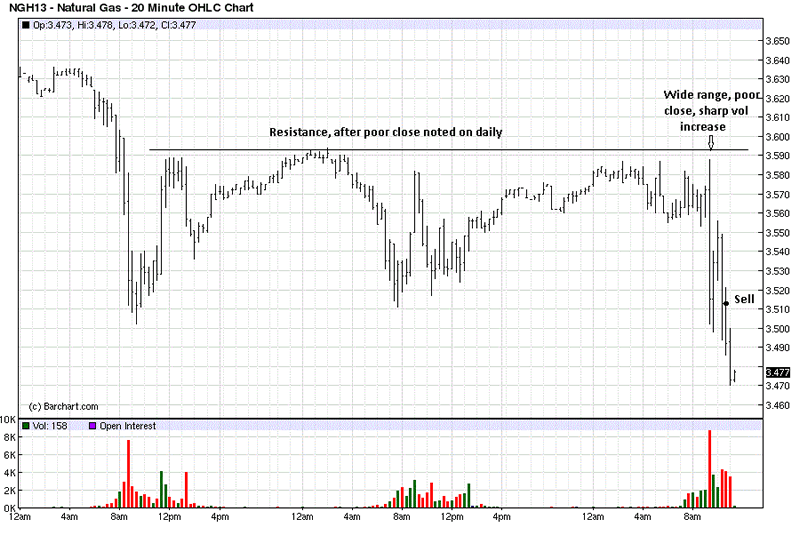
All we needed to see was weakness, on increased volume, followed by a weak rally, and the market was saying this potential short is a "go." You can see where the day activity remained under short-term resistance, and a wide range bar lower, with a poor close, on increased volume was the message from the market that we wanted to see, based on a decision made the prior evening.
Distractions being what they are, we missed the weak rally for establishing a better position. Note how volume dropped sharply as price rallied two bars later. Having missed it, we caught the next move down, also on increased volume, for a short position.
Anyone who believes markets are random simply has no clue what developing market activity means. That ignorance forms the basis for making such irrational statements, and that form of ignorance spreads as an acceptable view of how unpredictable "random" events are in the markets. To each their own.
What remains now is managing the trade. a protective buy stop is placed above the high, for anything can happen. We have no clue as to HOW the market will develop from here. Even though we like Natural Gas as a long potential, we remain flexible enough to accept a trade potential opposite of expressed sentiment. Opinions always take a back seat to developing market activity.
A buy order has been placed to cover half the position at 3.420, just in case price reaches that area. It would lock in a profit and reduce risk exposure on the trade. If half the position is filled there, managing the balance has more breathing room.
Of course, we have no clue how the market will develop from here, and price can just as readily reverse and rally. All we know is that the probability of a winning trade is greater than that of losing, and we cannot ask for more.

By Michael Noonan
Michael Noonan, mn@edgetraderplus.com, is a Chicago-based trader with over 30 years in the business. His sole approach to analysis is derived from developing market pattern behavior, found in the form of Price, Volume, and Time, and it is generated from the best source possible, the market itself.
© 2013 Copyright Michael Noonan - All Rights Reserved Disclaimer: The above is a matter of opinion provided for general information purposes only and is not intended as investment advice. Information and analysis above are derived from sources and utilising methods believed to be reliable, but we cannot accept responsibility for any losses you may incur as a result of this analysis. Individuals should consult with their personal financial advisors.
Michael Noonan Archive |
© 2005-2022 http://www.MarketOracle.co.uk - The Market Oracle is a FREE Daily Financial Markets Analysis & Forecasting online publication.


