


Another Look at Corporate Cash Hoarding
Companies / Corporate Earnings Feb 09, 2013 - 01:58 PM GMTBy: Andy_Sutton

 With Graham Mehl… In the most recent copy of the St. Louis Fed’s ‘Regional Economist’, two of its researchers query the status of corporate cash. Specifically, they’re interested in why companies are hoarding so much of it. Normally, such an article wouldn’t be noteworthy, but in this case we feel that delving into such an issue will be of assistance in terms of helping the average person to understand the truly broken nature of our economic and monetary systems.
During the course of the article, the researchers pose what would be considered normally expected explanations for this pile up of cash: tax-avoidance, structural changes in the business environment, and even the cost of research and development. We don't doubt that these are probably among the subset of correct answers, perhaps with a few additions varying by particular fields. However, we found it much more interesting and instructive to ask where the cash came from than why it was being accumulated. The media, especially in America, has gone out of its way to portray a robust economic recovery. This would lead one to conclude that these piles of cash came from business activity. We’ll see if the data and trends validate that conclusion.
Certainly we get the sense in our daily conversations that people are starting (finally) to realize that something is wrong, but it is hard to get into a detailed discussion because most willingly profess at least some level of ignorance to the tenets of corporate finance. Our goal, therefore, is not to craft a treatise on corporate finance as there are already too many of them, but to rather distill out the most pertinent information so the average person can form a basic understanding of money at the corporate level and what the hoarding of money by corporations in the aggregate tells us about everything going on around us.
If one is to understand investments, it is imperative that a basic understanding of how monetary strategy at the corporate level plays out in terms of financial statements, ratios, and such. Corporations are indeed loaded with cash, especially when compared with historic measurements. Let’s pose a couple of questions, then provide the reader with information to answer them as we progress.
- Is it possible that captains of industry know which way the wind is blowing regarding interest rates, the macroeconomic environment, and the capital markets?
- Is this a trend that is spanning out amongst all business or are the numbers being skewed by certain sectors?
- What role does government interference (either positive or negative) have on the cash strategies of corporations?
- What is the likelihood that there are ‘hidden agendas’ at work regarding the hoarding of cash, especially considering the fragility of the dollar standard system?
Where Does a Company’s Cash Come From?
For the purposes of this discussion when we say the term corporation, we’re referring to fully incorporated entities rather than sole proprietorships and most partnerships. Companies really don’t have many ‘traditional’ ways of getting their hands on cash. They can issue stock through various types of offerings, issue debt instruments through similar mechanisms, or generate revenues. While subsidies are a very real occurrence, we’re not going to focus on them as a primary form of cash generation.
All of these means, save for revenue generation, are self-limiting, however. A company that focuses on debt to increase its cash position and doesn’t have a worthy revenue stream would traditionally find itself either unable to borrow additional funds or would be required to pay a much higher rate of interest on borrowed funds or perhaps offer some type of collateral much in the way a home ‘owner’ with a mortgage offers their home as collateral. We call this a secured loan; there is some type of security that the lender will get its money back. It is essential to note that while the focus these past several years has been on lender discipline in the retail credit markets, there has been very little attention paid to the same discipline as it applies to corporations. The result has been predictable; corporations are using debt (specifically cheap debt) as one of its means of primary cash generation.
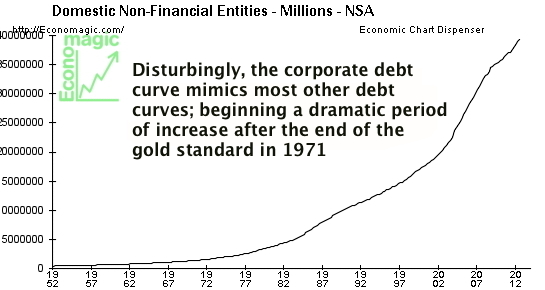
As can be observed from the above graphic, non-financial corporate debt is quickly approaching the $4 trillion mark. Note that the ‘Great Recession’ of 2009-2011 as pronounced by the American Government barely affected the slope of the debt curve. In similar fashion to almost every other debt metric, the accumulation of significant amounts of corporate debt began shortly after the end of Bretton Woods and the gold standard in 1971.
Put plainly, corporate America never retrenched. Where the consumer enjoyed a brief period of contraction in certain of its debt categories, corporate America never blinked an eye. This would beg another important question: Did America ever really experience a credit crunch in the 2008-2010 period? Banks certainly might have been a tad skittish about lending to each other, but corporations had no problem continuing to grow their appetites for financing. We posit here that the idea of a full-blown credit crunch was largely a media event, driven by hysteria and a desire for shock headlines more than any tangible event. There were many benefactors of the idea of a credit crunch, however, that is another topic for another endeavour.
This is where we get to an important point. Both the American and European media love to use financial ratios with colorful arrows to accentuate whatever point they’re trying to make. One of the common metrics used to measure the creditworthiness of companies is the debt/equity ratio. Simply, total liabilities/shareholder equity. The higher the number, the ‘worse’ the shape a company is in. The lower the number, the better. Opinions vary greatly on the exact levels that signify danger, but let’s use 1.0, meaning one dollar of equity for every dollar in total liabilities.
What we have seen over the past nearly 4 years now is a media that is literally frothing with the news of ‘healthy American companies’ and they point to falling debt/equity ratios as proof, as is evidenced in the graphic below, which portrays D/E ratios for the S&P500 Industrials components:
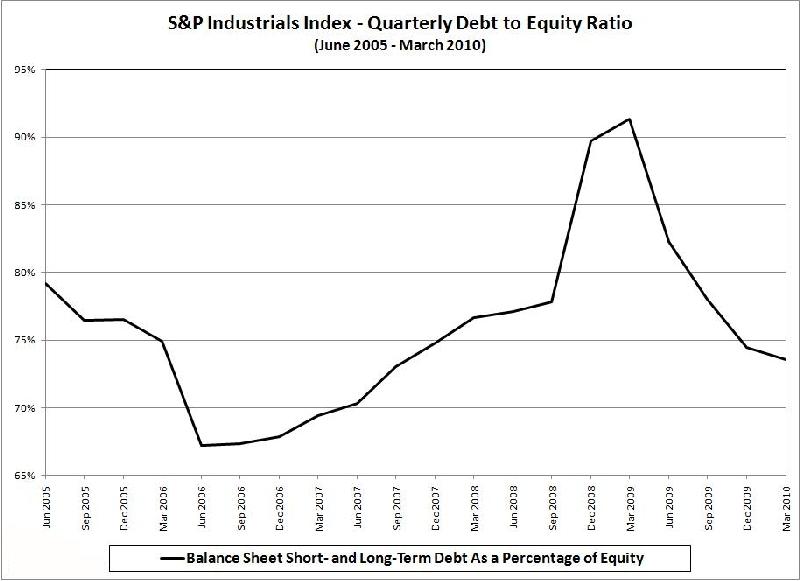
It is absolutely critical that the reader understand the ‘equity’ portion of the formula referenced above. “Shareholder Equity” or ‘Equity” is another term for stock price times the number of shares outstanding. The higher the stock price goes, the greater the equity given a constant number of shares. So if a company can grow its equity (via stock price) faster than its debt, we’ll see the D/E ratios fall – all other things constant, including earnings.
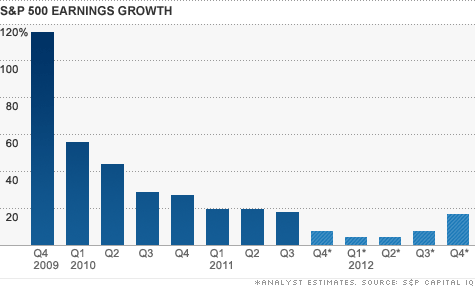
From the chart below it is pretty easy to see that earnings have not been a positive contributor, at least from a growth perspective. While aggregate earnings have increased, at least in nominal terms, growth has all but stalled. Note, the chart below contains forecasts for Q4 2011 forward rather than actual earnings data. The point here is to show the decreasing availability of cash from earnings from the 2009 period. A healthy S&P500 would have derived the lion’s share of its cash from revenues (earnings) rather than via debt acquisition.
The other primary area of cash acquisition is through equity offerings. This happens when companies either ‘go public’ with an initial offering or do secondary offerings to generate more cash. Obviously equity offerings don’t count as debt, so many might construe an equity offering to be a win-win because it increases both a company’s cash and its shareholder’s equity. The problem exists in that a company can’t just constantly run to the capital markets and do secondary offerings every time it needs some more cash. These moves are generally strategic and longer-horizon in nature and are planned well in advance. A history of running to the proverbial well does not generally bode well when it comes to successful subsequent offerings or bond sales for that matter. A company that abuses the privilege often runs into lower proceeds from future offerings or finds that the market commands higher rates of interest.
We can note from the graphic below that 2012’s total of $168 billion was the highest since the last major bubble year – 2000. Perhaps oddly, 2009 was the third highest in the first decade of the new century coming in at $157 billion. There is a definite trend in place here. 2000 represented a cycle (1982-2000) peak followed by three years of declines, then another run up into 2009. 2010 dropped off dramatically and the next trend resumed.
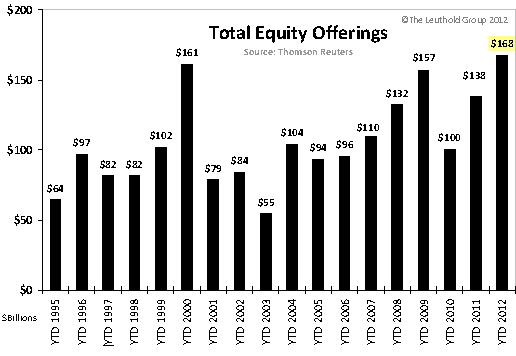
Of 2012’s total of $168 billion in total offerings, just $34 billion of that were initial offerings, along with $7 billion in 2009, $14 billion in 2010, and $32 billion in 2011. The vast majority of offering dollars were from secondary offerings and the amount is increasing, meaning that companies are coming to rely more heavily on the equity offerings for cash.
In conclusion, of the three major sources of cash that we pointed out at the beginning of the article, the only one that is derived from business activity (earnings) is on the decline while reliance on debt and equity offerings is on the increase. So we can answer semi-quantitatively the question of where firms are getting their cash.
Oddly this conclusion, for the most part, agrees with the article in this quarter’s Regional Economist, although you have to read between the lines a bit to find it. The Federal Reserve has never been terribly secretive about the information it is willing to provide to the public and has come to rely on ignorance, apathy, and misdirection promulgated by media outlets to accomplish the ultimate whitewash.
As we are sure most readers already realize, the Federal Reserve and US Government are two of the most active economic agents working at the macroeconomic level today. The Federal Reserve being the lender and buyer of last resort while the US Government is the consumer of last resort. When the people refuse to spend and instead go into Japanese mode and become savers or even the slightest bit credit-averse, the US Government spends on their behalf. The majority of the 50 states and many smaller subdivisions of government have followed this model as well.
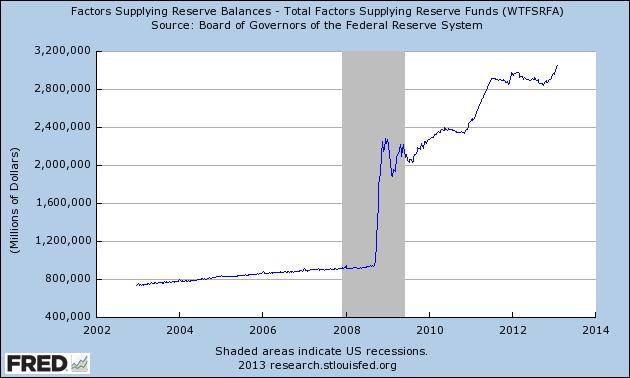
As is illustrated in the chart above, the Federal Reserve’s balance sheet has ballooned to nearly 4 times what it was pre-crisis. And these are the public acquisitions and the data are skewed at best. The sum of QE actions alone in the past year is not being accurately depicted, not to mention the assets held at the money center banks that are ostensibly the owners of the Federal Reserve. It is long past time that this be accepted as an established fact rather than debated as a theory. The fact that a private bank is believed by so many Americans to be part of the US Government provides a great deal of humor for those in other parts of the world, but only to a certain extent as their countries are also dominated in a similar fashion.
Which brings us to the topic of prior knowledge. The media has purported many of our financial crisis events as either economic or financial accidents that happen due to the velocity and confluence of certain factors. The bottom line is that the idea is projected that these events cannot be predicted with any real accuracy.
A quick anecdotal look at the money raised by corporations in equity offerings might help us to shed a bit of light on this. We can see a reasonable trend leading into the 2000 technology rout. We can see a very well defined trend leading into the market crash of 2008. Companies were going to the well more and more often. While this rush to accumulate cash certainly lines up rather nicely with crisis events, it doesn’t line up so well with the business cycle when looked at in authentic, non-traditional GDP terms. For example, using the Cobb-Douglas production function, which is an alternative measurement of output, America entered the ‘Great Recession’ in late 2006 as properly identified in this publication at the time, and despite heroic measures, has yet to leave that recessionary event.
The exodus from the recession event in traditional terms has been due almost entirely to government activity rather than that of business or consumers. This is one of the reasons the recovery, if you’ll forgive us for calling it that, has never achieved what is referred to as escape velocity. The deficit spending and Federal Reserve intervention are still necessary to maintain the appearance of growth and even that was not in enough this past quarter.
There have been a bevy of analysts globally who accurately have predicted the technology-led downturn that started in 2000 and the crisis of 2008, the crash of the US residential real estate market, and the subsequent stagflationary period. Prior knowledge was easily obtained in all these instances by merely studying the information available in its proper context. This context will never be achieved by those who wish to absorb a steady diet of propaganda from conventional media outlets either in the United States or elsewhere.
We can safely recognize that captains of industry the globe over knew what was going to happen, if not specifically, at least in generalities with regards to the capital markets, and acted accordingly. The fact that corporations are stockpiling cash in the face of what we are led to believe is a slow but thriving economic recovery represents prima facie evidence that the recovery is a concocted sham and that corporations are expecting further difficult times. The reality that they’re accumulating dollars given the future prospects for the king of paper currencies does nothing but underscore that point.
Graham Mehl is a pseudonym. He currently works for a hedge fund and is responsible for economic forecasting and modeling. He has a graduate degree with honors from The Wharton School of the University of Pennsylvania among his educational achievements. Prior to his current position, he served as an economic research associate for a G7 central bank.
By Andy Sutton
http://www.my2centsonline.com
Andy Sutton holds a MBA with Honors in Economics from Moravian College and is a member of Omicron Delta Epsilon International Honor Society in Economics. His firm, Sutton & Associates, LLC currently provides financial planning services to a growing book of clients using a conservative approach aimed at accumulating high quality, income producing assets while providing protection against a falling dollar. For more information visit www.suttonfinance.net
Andy Sutton Archive |
© 2005-2022 http://www.MarketOracle.co.uk - The Market Oracle is a FREE Daily Financial Markets Analysis & Forecasting online publication.